Tag: SRE

  • Book Summary: SRE, Part 3, Service Level Indicators (SLIs), Objectives (SLOs), and Agreements (SLAs)

    Book Summary: SRE, Part 3, Service Level Indicators (SLIs), Objectives (SLOs), and Agreements (SLAs)

    In this article, We are going to learn about Site Reliability Engineering (SRE) core terminologies. It’s important to understand those terms because they are used a lot nowadays in the software industry. I know that learning terminologies might sound boring or complex but I will try to make it simple and as practical as possible. We will use the shakespeare service explained before in part one as an example service so please make sure you check that first. It’s also important to check part2 when we talked about error budgets if you haven’t already. without further ado Let’s start with Service Level Indicators (SLIs).

    SLI or Service Level Indicator

    SLI or Service Level Indicator is a metric (a number) that helps us define how our service is performing,  For example:

    • Request Latency: how long it takes to return a response to a request.
    • Error Rate: the fraction or requests with errors (e.g. an API returns 500)
    • System throughput: how many requests we got per seconds
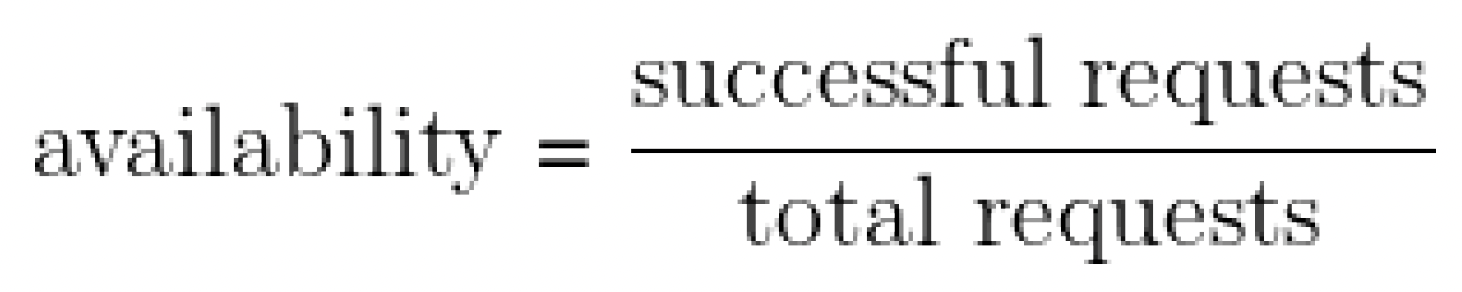
    • Availability: the fraction of well-formed requests that succeed. 100% availability is impossible, near-100% availability is achievable. We express high-availability values in terms of the number of ”nines” in the availability percentage. For example, availability of 99.99% can be referred to as ”4 nines” availability.
    • Durability: the likelihood that data will be retained over a long period of time. It’s important for data storage systems.

    There are more metrics we can collect to give us more insight about our system health but the question here is that how can we actually identify what metrics are meaningful to our system? The answer is simple, “It depends!!”. it depends on what you and your users care about.

    We shouldn’t use every metric we can track in our monitoring system as an SLI. Choosing too many indicators makes it hard to pay the right level of attention to the indicators that matter, while choosing too few may leave significant behaviors of our system unexamined. We typically find that a handful of representative indicators are enough to evaluate and reason about a system’s health. Services tend to fall into a few broad categories in terms of the SLIs they find relevant:

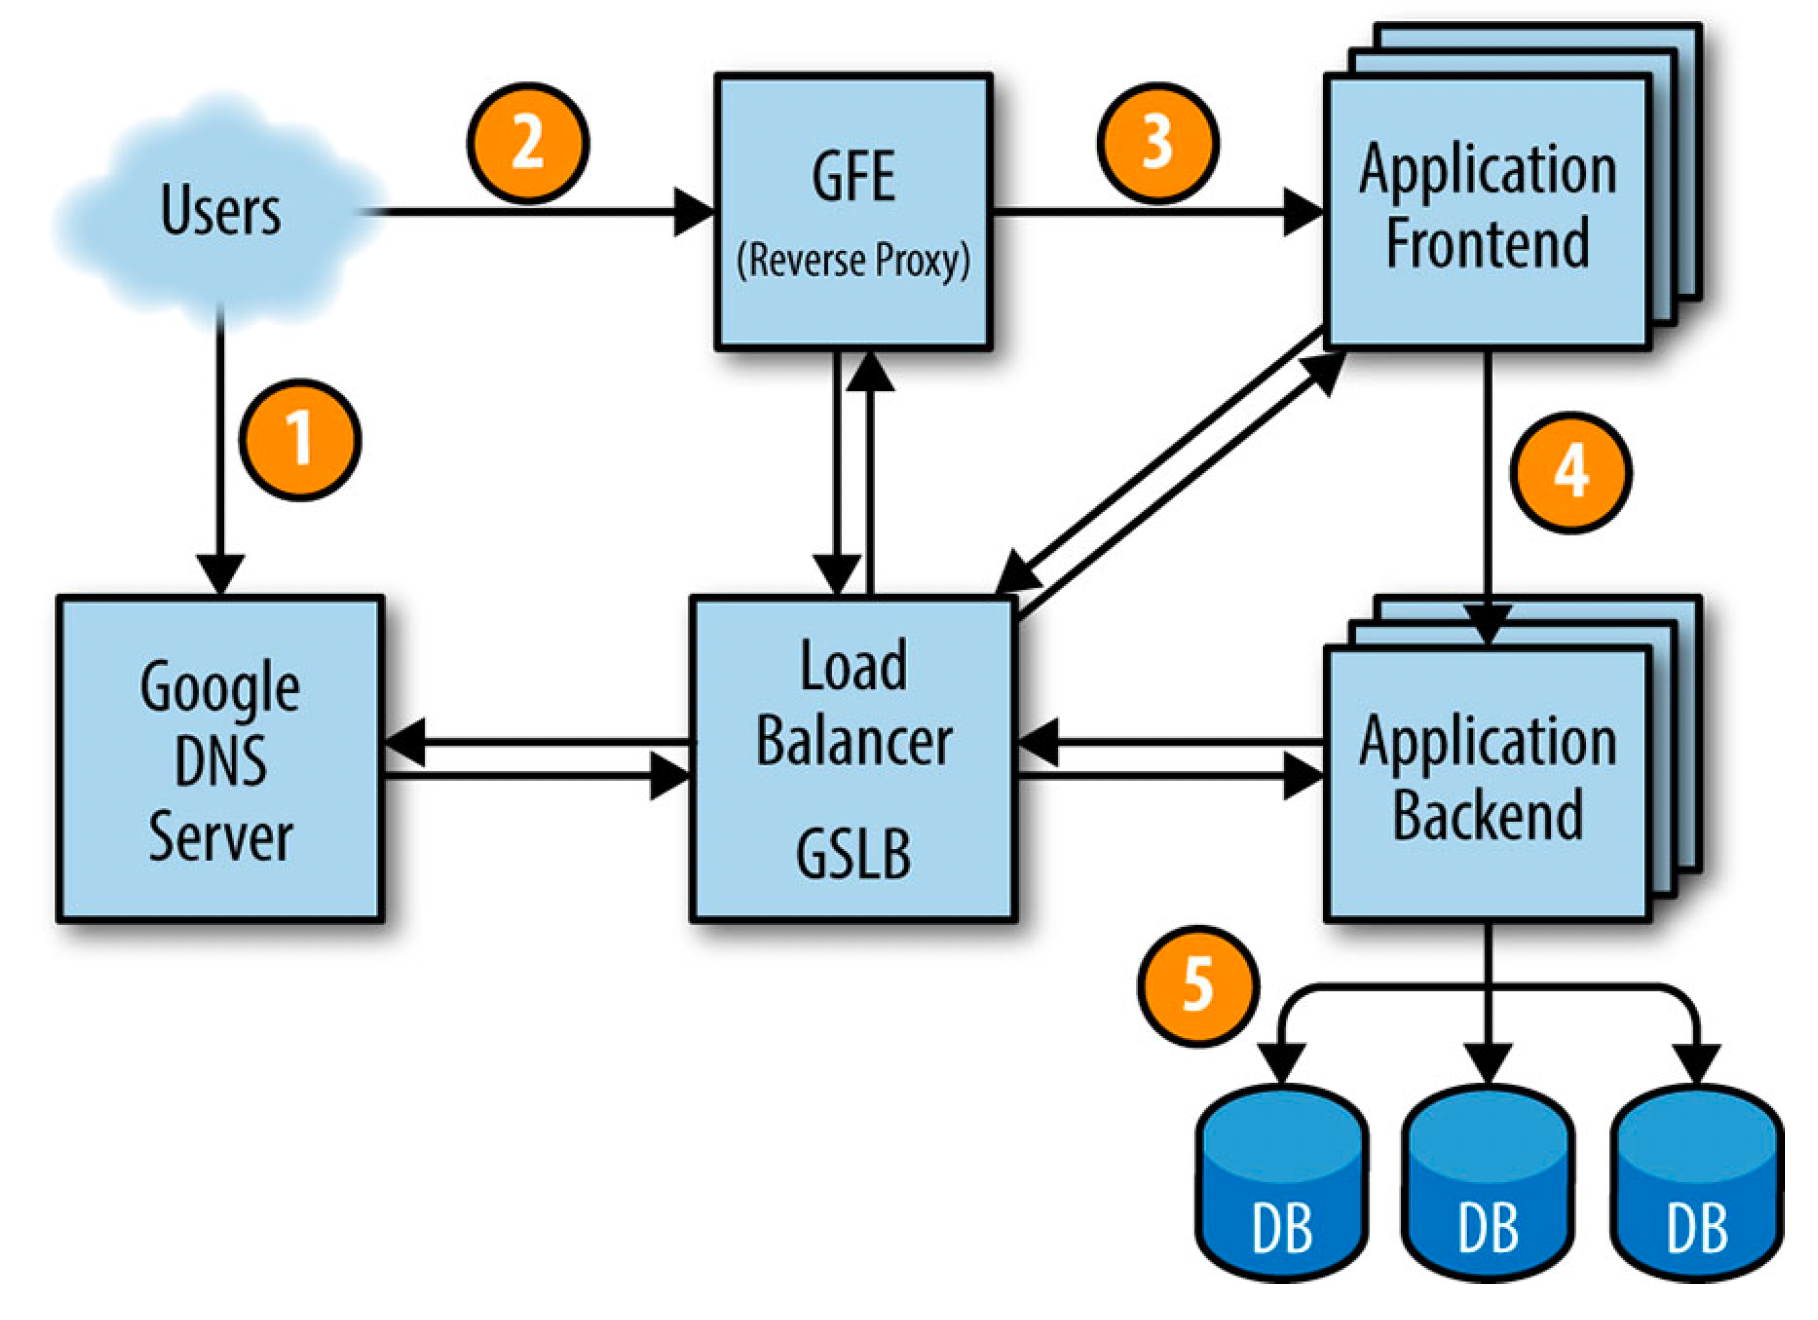
    • User-facing serving systems, such as the Shakespeare search frontends, generally care about availability, latency, and throughput. In other words: Could we respond to the request? How long did it take to respond? How many requests could be handled?
    • Storage systems often emphasize latency, availability, and durability. In other words: How long does it take to read or write data? Can we access the data on demand? Is the data still there when we need it?
    • Big data systems, such as data processing pipelines, tend to care about throughput and end-to-end latency. In other words: How much data is being processed? How long does it take the data to progress from ingestion to completion?

    To use those metrics as SLI, we need to collect and aggregate them on the server side, using a monitoring system such as Prometheus. However, some systems should be instrumented with client-side collection, because not measuring behavior at the client can miss a range of problems that affect users but don’t affect server side metrics. For example, concentrating on the response latency of the Shakespeare search backend might miss poor user latency due to problems with the page’s JavaScript: in this case, measuring how long it takes for a page to become usable in the browser is a better proxy for what the user actually experiences.

    SLO or Service Level Objective

    SLO or Service Level Objective is a target value or range of values for a service level that is measured by an SLI. For example, we can set the SLO for shakespare service as follows:

    • average search request latency should be less than 100 milliseconds
    • availability should be 99.99% which means error rate should be 0.01%

    SLOs should specify how they’re measured and the conditions under which they’re valid. For instance, we might say the following:

    • 99% (averaged over 1 minute) of Get requests will complete in less than 300 ms (measured across all the backend servers).

    If the shape of the performance curves are important, then you can specify multiple SLO targets:

    • 90% of Get requests will complete in less than 100 ms.
    • 99% of Get requests will complete in less than 300 ms.
    • 99.9% of Get requests will complete in less than 500 ms.

    It’s both unrealistic and undesirable to insist that SLOs will be met 100% of the time: doing so can reduce the rate of innovation and deployment, require expensive, overly conservative solutions, or both. Instead, it is better to allow an error budget.

    So, How can we actually choose targets  (SLOs)? Here are few lessons from google that can help:

    • Keep it simple. Complicated aggregations in SLIs can obscure changes to system performance, and are also harder to reason about.
    • Avoid absolutes. While it’s tempting to ask for a system that can scale its load ”infinitely” without any latency increase and that is ”always” available, this requirement is unrealistic.
    • Have as few SLOs as possible. Choose just enough SLOs to provide good coverage of your system’s attributes. If you can’t ever win a conversation about priorities by quoting a particular SLO, it’s probably not worth having that SLO.
    • Perfection can wait. You can always refine SLO definitions and targets over time as you learn about a system’s behavior. It’s better to start with a loose target that you tighten than to choose an overly strict target that has to be relaxed when you discover it’s unattainable.

    SLOs should be a major driver in prioritizing work for SREs and product developers, because they reflect what users care about. A poorly thought-out SLO can result in wasted work if a team uses extreme efforts to meet or it can result in a  bad product if it is too loose.

    SLA or service level agreement

    SLA or service level agreement is an explicit or implicit contract with your users that includes consequences of meeting (or missing) the SLOs they contain.

    SRE doesn’t typically get involved in constructing SLAs, because SLAs are closely tied to business and product decisions. SRE helps to avoid triggering the consequences of missed SLOs. They can also help to define the SLIs.

    Conclusion

    SLI is a metric that helps us define how our service is performing,  For example the Request Latency error rate. SLO is a target value for a service level that is measured by an SLI. For example the request latency should be less than 100 milliseconds or availability should be 99.99% which means error rate should be 0.01%. SLA is an explicit or implicit contract with the users that includes consequences of meeting (or missing) the SLOs they contain.

    Next, We are going to learn more about how to automate boring and repetitive tasks.

  • Book Summary: Site Reliability Engineering, Part 2, Error Budgets and Service Level Objectives (SLOs)

    Book Summary: Site Reliability Engineering, Part 2, Error Budgets and Service Level Objectives (SLOs)

    It would be nice to build 100% reliable services. Ones that never fail. right? absolutely not. It’s going to be really bad to do such a thing because it’s very expensive and it will limit how fast new features can be developed and delivered to the users. Also users typically won’t notice the difference between high reliability and extreme reliability in a service, because the user experience is dominated by less reliable components like the cellular network or the device they are working with. With this in mind, rather than simply maximizing uptime, Site Reliability Engineering seeks to balance the risk of unavailability with the goals of rapid innovation and efficient service operations, so that users’ overall happiness—with features, service, and performance—is optimized.

    Here is how we measure availability for a service:

    Aggregate availability


    For example, a system that serves 2.5M requests in a day with a daily availability target of 99.99% can serve up to 250 errors and still hit its target for that given day.

    Why Error Budgets

    There is always tension between product development teams and SRE teams, given that they are generally evaluated on different metrics. Product development performance is largely evaluated on product velocity, which creates an incentive to push new code as quickly as possible. Meanwhile, SRE performance is evaluated based upon reliability of a service, which implies an incentive to push back against a high rate of change.

    For example, Let’s say we want to define the push frequency for a service, given that every push is risky then SRE will push for fewer deployments. On the other side, the product development team will push for more deployment because they want their work to reach the users.

    Our goal here is to define an objective metric, agreed upon by both sides, that can be used to guide the negotiations in a reproducible way. The more data-based the decision can be, the better.

    How to define Your Error Budget?

    In order to base these decisions on objective data, the two teams jointly define a quarterly error budget based on the service’s service level objective, or SLO. The error budget provides a clear, objective metric that determines how unreliable the service is allowed to be within a single quarter. This metric removes the politics from negotiations between the SREs and the product developers when deciding how much risk to allow.

    Our practice is then as follows:

    • Product Management defines an SLO, which sets an expectation of how much uptime the service should have per quarter.
    • The actual uptime is measured by our monitoring/observability system.
    • The difference between these two numbers is the ”budget” of how much ”unreliability” is remaining for the quarter.
    • As long as the uptime measured is above the SLO—in other words, as long as there is error budget remaining—new releases can be pushed.

    For example, imagine that a service’s SLO is to successfully serve 99.999% of all queries per quarter. This means that the service’s error budget is a failure rate of 0.001% for a given quarter. If a problem causes us to fail 0.0002% of the expected queries for the quarter, the problem spends 20% of the service’s quarterly error budget.

    The Benefits of Error Budgets

    The main benefit of an error budget is that it provides a common incentive that allows both product development and SRE to focus on finding the right balance between innovation and reliability.

    Many products use this control loop to manage release velocity: as long as the system’s SLOs are met, releases can continue. If SLO violations occur frequently enough to expend the error budget, releases are temporarily halted while additional resources are invested in system testing and development to make the system more resilient, improve its performance, and so on. More subtle and effective approaches are available than this simple on/off technique, for instance, slowing down releases or rolling them back when the SLO-violation error budget is close to being used up.

    For example, if product development wants to skimp on testing or increase push velocity and SRE is resistant, the error budget guides the decision. When the budget is large, the product developers can take more risks. When the budget is nearly drained, the product developers themselves will push for more testing or slower push velocity, as they don’t want to risk using up the budget and stall their launch. In effect, the product development team becomes self-policing. They know the budget and can manage their own risk. (Of course, this outcome relies on an SRE team having the authority to actually stop launches if the SLO is broken.)

    What happens if a network outage or datacenter failure reduces the measured SLO? Such events also eat into the error budget. As a result, the number of new pushes may be reduced for the remainder of the quarter. The entire team supports this reduction because everyone shares the responsibility for uptime.

    The budget also helps to highlight some of the costs of overly high reliability targets, in terms of both inflexibility and slow innovation. If the team is having trouble launching new features, they may elect to loosen the SLO (thus increasing the error budget) in order to increase innovation.

    Conclusion

    • Managing service reliability is largely about managing risk, and managing risk can be costly.
    • 100% is probably never the right reliability target: not only is it impossible to achieve, it’s typically more reliability than a service’s users want or notice. Match the profile of the service to the risk the business is willing to take.
    • An error budget aligns incentives and emphasizes joint ownership between SRE and product development. Error budgets make it easier to decide the rate of releases and to effectively defuse discussions about outages with stakeholders, and allows multiple teams to reach the same conclusion about production risk without problems.
  • Book Summary: Site Reliability Engineering, Part 1, How a service would be deployed at Google scale

    Book Summary: Site Reliability Engineering, Part 1, How a service would be deployed at Google scale

    How to deploy an application so that it works well at large scale? Of course there is no easy answer for such a question. It probably would take an entire book to explain that. Fortunately, in Site Reliability Engineering book, Google explained briefly what it might be like.

    They explained how to deploy sample service in the Google production environment. This will give us more insights on how complex it might get if we would deploy a simple service to serve millions of users around the world.

    Suppose we want to offer a service that lets you determine where a given word is used throughout all of Shakespeare’s works. It’s a typical search problem which means that it can be divided into two components:

    1. Indexing and writing the index into a Bigtable. This can be run once or frequently based on the problem (in Shakespeare’s case, it’s enough to run it once). This can be implemented using MapReduce  (scroll down for a simpler example of MapReduce task) which will split Shakespeare’s work (text) into hundreds of parts, assign each part to a worker, all workers should run in parallel then they will send the results to a reducer task which will create a tuple of (word, list of locations) and write it to  a row in a Bigtable, using the word as the key.
    2. A frontend application for users to be able to search for words and see the results.

    Here is how a user request will be served:

    how a user request will be served

    First, the user goes to shakespeare.google.com to obtain the corresponding IP address from Google’s DNS server, which talks to GSLB to pick which server IP address to send to this user. The browser connects to the HTTP server on this IP. This server (named the Google Frontend, or GFE) is a reverse proxy that terminates the TCP connection (2).

    The GFE looks up which service is required (web search, maps, or—in this case—Shakespeare). Again using GSLB, the server finds an available Shakespeare frontend server, and sends that server an RPC containing the HTTP request (3).

    The Shakespeare frontend server now needs to contact the Shakespeare backend server: The frontend server contacts GSLB to obtain the BNS address of a suitable and unloaded backend server (4).

    That Shakespeare backend server now contacts a Bigtable server to obtain the requested data (5).

    The answer is returned to the Shakespeare backend server. The backend hands the results to the Shakespeare frontend server, which assembles the HTML and returns the answer to the user.

    This entire chain of events is executed in the blink of an eye—just a few hundred milliseconds! Because many moving parts are involved, there are many potential points of failure; in particular, a failing GSLB would break the entire application. How can we protect our application from single point of failure and make it more reliable? That’s what will be covered in the next section.

    Ensuring Reliability

    Let’s assume we did load testing for our infrastructure and found that one backend server can handle about 100 queries per second (QPS). Let’s also assume that it’s expected to get about 3500 QPS as a peak load, so we need at least 35 replicas of the backend server. But actually we need 37 tasks in the job, or N+2 because:

    • During updates, one task at a time will be unavailable, leaving 36 tasks.
    • A machine failure might occur during a task update, leaving only 35 tasks, just enough to serve peak load.

    A closer examination of user traffic shows our peak usage is distributed globally:

    • 1,430 QPS from North America,
    • 290 QPS from South America,
    • 1,400 QPS from Europe and Africa,
    • 350 QPS from Asia and Australia.

    Instead of locating all backends at one site, we distribute them across the USA, South America, Europe, and Asia. Allowing for N+2 redundancy per region means that we end up with

    • 17 tasks in the USA,
    • 16 in Europe,
    • 6 in Asia,
    • 5 in South America

    However, we decided to use 4 tasks (instead of 5) in South America, to lower the overhead of N+2 to N+1. In this case, we’re willing to tolerate a small risk of higher latency in exchange for lower hardware costs. If GSLB redirects traffic from one continent to another when our South American datacenter is over loaded, we can save 20% of the resources we’d spend on hardware. In the larger regions, we’ll spread tasks across two or three clusters for extra resiliency.

    Because the backends need to contact the Bigtable holding the data, we need to also design this storage element strategically. A backend in Asia contacting a Bigtable in the USA adds a significant amount of latency, so we replicate the Bigtable in each region. Bigtable replication helps us in two ways:

    1. It provides resilience when a Bigtable server fail
    2. It lowers data-access latency.

    Conclusion

    This was just a quick introduction about how it would be like to design a reliable system. Of course the reality is much more complicated than this. Next we will take a deeper look at some SRE terminologies and how to implement them in our organisations.

    An simpler example of MapReduce

    This is a very simple example of MapReduce. No matter the amount of data you need to analyze, the key principles remain the same.

    Assume you have ten CSV files with three columns (date, city, temperature). We want to find the maximum temperature for each city across the data files (note that each file might have the same city represented multiple times).

    Using the MapReduce framework, we can break this down into ten map tasks, where each mapper works on one of the files. The mapper task goes through the data and returns the maximum temperature for each city.

    For example, (Cairo, 45) (Berlin, 32) (Porto, 33) (Rome, 36)

    After all map tasks are done, the output streams would be fed into the reduce tasks, which combine the input results and output a single value for each city, producing a final result.

    For example, (Cairo, 46) (Berlin, 32) (Porto, 38) (Rome, 36), Barcelona (40), ..