Jaeger is an open-source distributed tracing system that is used to monitor and troubleshoot microservices-based architectures. Deploying Jaeger on AWS can help to improve the visibility and performance of your applications.
In this article, we will provide a step-by-step guide on how to deploy Jaeger on AWS.
Step 1: Set up an AWS Account
The first step in deploying Jaeger on AWS is to set up an AWS account. If you already have an AWS account, you can skip this step. Otherwise, you can sign up for a free AWS account at aws.amazon.com.
Step 2: Launch an EC2 Instance
The next step is to launch an EC2 instance on AWS. An EC2 instance is a virtual machine that runs on the AWS cloud. You can use any EC2 instance type, but we recommend using a t2.micro instance for testing purposes.
To launch an EC2 instance, follow these steps:
Go to the EC2 dashboard in the AWS Management Console.
Click on the “Launch Instance” button.
Choose the Amazon Linux 2 AMI.
Select the t2.micro instance type.
Configure the instance details and storage.
Configure the security group to allow inbound traffic on port 22 for SSH access and port 16686 for Jaeger access.
Launch the instance and create a new key pair.
Step 3: Install Jaeger
Once your EC2 instance is up and running, you can install Jaeger on it. Follow these steps:
Connect to your EC2 instance using SSH.
Update the system packages by running the command: sudo yum update -y
Install Jaeger by running the command: sudo yum install jaeger-all -y
Verify that Jaeger is installed by running the command: jaeger-all --version
Step 4: Configure Jaeger
After installing Jaeger, you need to configure it to work with your applications. Follow these steps:
Open the Jaeger configuration file by running the command: sudo vi /etc/jaeger/agent.yaml
Edit the configuration file to specify the correct collector endpoint and sampling rate. For example, you can set the following values:
After configuring Jaeger, you need to start the Jaeger agent. The Jaeger agent is responsible for receiving trace data from your applications and forwarding it to the Jaeger collector.
Follow these steps to start the Jaeger agent:
Open a new terminal window and connect to your EC2 instance using SSH.
Start the Jaeger agent by running the command: sudo systemctl start jaeger-agent
Step 6: Access the Jaeger UI
Once the Jaeger agent is running, you can access the Jaeger UI to view your trace data. Follow these steps:
The Jaeger UI should load, and you can start exploring your trace data.
Step 7: Integrate Jaeger with Your Applications
Finally, you need to integrate Jaeger with your applications to start collecting trace data. To do this, you need to add the Jaeger client libraries to your application code and configure them to send trace data to the Jaeger agent.
The exact process for integrating Jaeger with your applications will depend on the programming language and framework you are using. However, most Jaeger client libraries have similar APIs and can be integrated with minimal changes to your application code.
For example, if you are using Node.js, you can install the Jaeger client library using npm:
npm install --save jaeger-client
Then, you can configure the Jaeger client by adding the following code to your application:
This code initializes the Jaeger tracer with a sampler that always samples traces and a reporter that sends trace data to the Jaeger agent running on the local machine.
Once you have integrated Jaeger with your applications, you can start collecting and analyzing trace data to improve the performance and reliability of your microservices.
Conclusion
Deploying Jaeger on AWS can help you gain visibility into your microservices-based architectures and troubleshoot performance issues. In this article, we provided a step-by-step guide on how to deploy Jaeger on AWS and integrate it with your applications.
By following these steps, you can set up a distributed tracing system that can help you improve the performance and reliability of your applications running on AWS.
Containerization and container orchestration are two of the most essential technologies for modern software development. These technologies have revolutionized the way we build, deploy, and manage applications. In this article, we will provide a beginner’s guide to containerization and container orchestration using Docker and Kubernetes.
What is Containerization?
Containerization is the process of encapsulating an application and its dependencies into a single package called a container. The container provides a consistent and isolated environment for running the application. The containerization technology enables the developers to build, test and deploy applications more quickly and reliably.
What is Docker?
Docker is a containerization platform that provides an easy and efficient way to build, ship, and run containers. With Docker, you can package an application along with its dependencies and runtime environment into a container. Docker containers are lightweight, portable, and can run consistently across different environments.
How to Create a Docker Container?
Creating a Docker container involves the following steps:
Step 1: Create a Dockerfile
A Dockerfile is a simple text file that contains instructions for building a Docker image. The Dockerfile specifies the base image, copies the application code, installs the dependencies, and exposes the required ports.
Step 2: Build a Docker Image
Once you have created a Dockerfile, you can build a Docker image using the Docker build command. The Docker build command reads the instructions from the Dockerfile and creates a Docker image.
Step 3: Run a Docker Container
Once you have created a Docker image, you can run a Docker container using the Docker run command. The Docker run command starts a new container based on the specified Docker image.
What is Container Orchestration?
Container orchestration is the process of managing, deploying, and scaling containerized applications. It involves managing the lifecycle of containers, scheduling containers on a cluster of nodes, and ensuring that the containers are running and healthy.
What is Kubernetes?
Kubernetes is a container orchestration platform that automates the deployment, scaling, and management of containerized applications. Kubernetes provides a platform-agnostic way of deploying and managing containers.
How to Use Kubernetes?
Using Kubernetes involves the following steps:
Step 1: Create a Kubernetes Deployment
A Kubernetes deployment defines how many replicas of a container should be running and what container image to use.
Step 2: Create a Kubernetes Service
A Kubernetes service provides a stable IP address and DNS name for accessing the containers.
Step 3: Scale the Kubernetes Deployment
Kubernetes provides a simple way to scale the deployment up or down, depending on the traffic.
Step 4: Monitor the Kubernetes Deployment
Kubernetes provides several tools for monitoring the containers, including logs, metrics, and events.
Conclusion:
Containerization and container orchestration are critical technologies that have transformed software development. Docker provides an easy and efficient way to package and run containers, while Kubernetes automates the deployment, scaling, and management of containerized applications. By using Docker and Kubernetes, developers can build, test, and deploy applications more quickly and reliably. We hope that this beginner’s guide has provided you with a good understanding of containerization and container orchestration.
In today’s world, monitoring your application is more important than ever before. As applications become more complex, it becomes increasingly challenging to identify bottlenecks, troubleshoot issues, and optimize performance. Fortunately, OpenTelemetry provides a powerful framework for collecting, exporting, and processing telemetry data, making it easier to gain insight into your application’s behavior. In this article, we’ll provide a crash course in OpenTelemetry, explaining what it is, how it works, and how you can use it to monitor your applications.
What is OpenTelemetry?
OpenTelemetry is an open-source framework that provides a standard way to collect, export, and process telemetry data for distributed systems. It supports various languages and platforms, making it easy to integrate into your existing applications. The framework consists of three main components: the SDK, the OpenTelemetry Collector, and the exporters.
The SDK is responsible for instrumenting your application code and collecting telemetry data. It provides libraries for various languages, including Java, Python, Go, and .NET. The SDK also supports various metrics and trace APIs, allowing you to customize the telemetry data you collect.
The OpenTelemetry Collector is responsible for receiving, processing, and exporting telemetry data. It provides a flexible way to ingest data from various sources, including the SDK, third-party agents, and other collectors. The Collector also provides various processing pipelines for transforming and enriching the telemetry data.
Finally, the exporters are responsible for sending the telemetry data to various backends, including observability platforms such as Prometheus, Grafana, and Jaeger.
How does OpenTelemetry work?
OpenTelemetry works by instrumenting your application code with the SDK, which collects telemetry data and sends it to the OpenTelemetry Collector. The Collector then processes the data and exports it to the backends specified by the exporters. This process allows you to gain insight into your application’s behavior, identify issues, and optimize performance.
Let’s take a look at an example. Suppose we have a simple Python application that runs on a server and provides a REST API. We want to monitor the application’s performance, including the request latency, error rate, and throughput. We can use OpenTelemetry to collect this data and export it to Prometheus for visualization and analysis.
First, we need to install the OpenTelemetry SDK for Python:
Next, we need to instrument our application code with the SDK. We can do this by adding the following lines of code:
from opentelemetry import trace
from opentelemetry.instrumentation.wsgi import OpenTelemetryMiddleware
from opentelemetry.sdk.trace import TracerProvider
from opentelemetry.exporter.prometheus import PrometheusMetricsExporter

# Initialize the tracer provider
trace.set_tracer_provider(TracerProvider())

# Create the Prometheus exporter
exporter = PrometheusMetricsExporter(endpoint="/metrics")

# Add the Prometheus exporter to the tracer provider
trace.get_tracer_provider().add_span_processor(
    BatchExportSpanProcessor(exporter)
)

# Instrument the WSGI application with OpenTelemetryMiddleware
app = OpenTelemetryMiddleware(app)
This code initializes the tracer provider, creates a Prometheus exporter, adds the exporter to the tracer provider, and instruments the WSGI application with OpenTelemetryMiddleware. Now, every request to our API will be instrumented with OpenTelemetry, and the telemetry data will be exported to Prometheus.
Finally, we can use Prometheus to visualize and analyze the telemetry data. We can open the Prometheus web UI and navigate to the /metrics endpoint to view the exported data. We can then create graphs, alerts, and dashboards to monitor our application performance and identify issues.
Why use OpenTelemetry?
OpenTelemetry provides several benefits for monitoring your applications:
Standardization: OpenTelemetry provides a standard way to collect, export, and process telemetry data, making it easier to integrate with various platforms and tools.
Flexibility: OpenTelemetry supports various languages, platforms, and backends, making it easy to use with your existing infrastructure.
Customization: OpenTelemetry provides various APIs for customizing the telemetry data you collect, allowing you to monitor specific aspects of your application’s behavior.
Open-source: OpenTelemetry is open-source and community-driven, ensuring that it remains relevant and up-to-date with modern monitoring practices.
Interoperability: OpenTelemetry integrates with various observability platforms, making it easy to share telemetry data across your organization.
Conclusion
Monitoring your applications is essential for identifying issues, optimizing performance, and ensuring a good user experience. OpenTelemetry provides a powerful framework for collecting, exporting, and processing telemetry data, making it easier to gain insight into your application’s behavior. By using OpenTelemetry, you can standardize your monitoring practices, customize the telemetry data you collect, and integrate with various observability platforms.
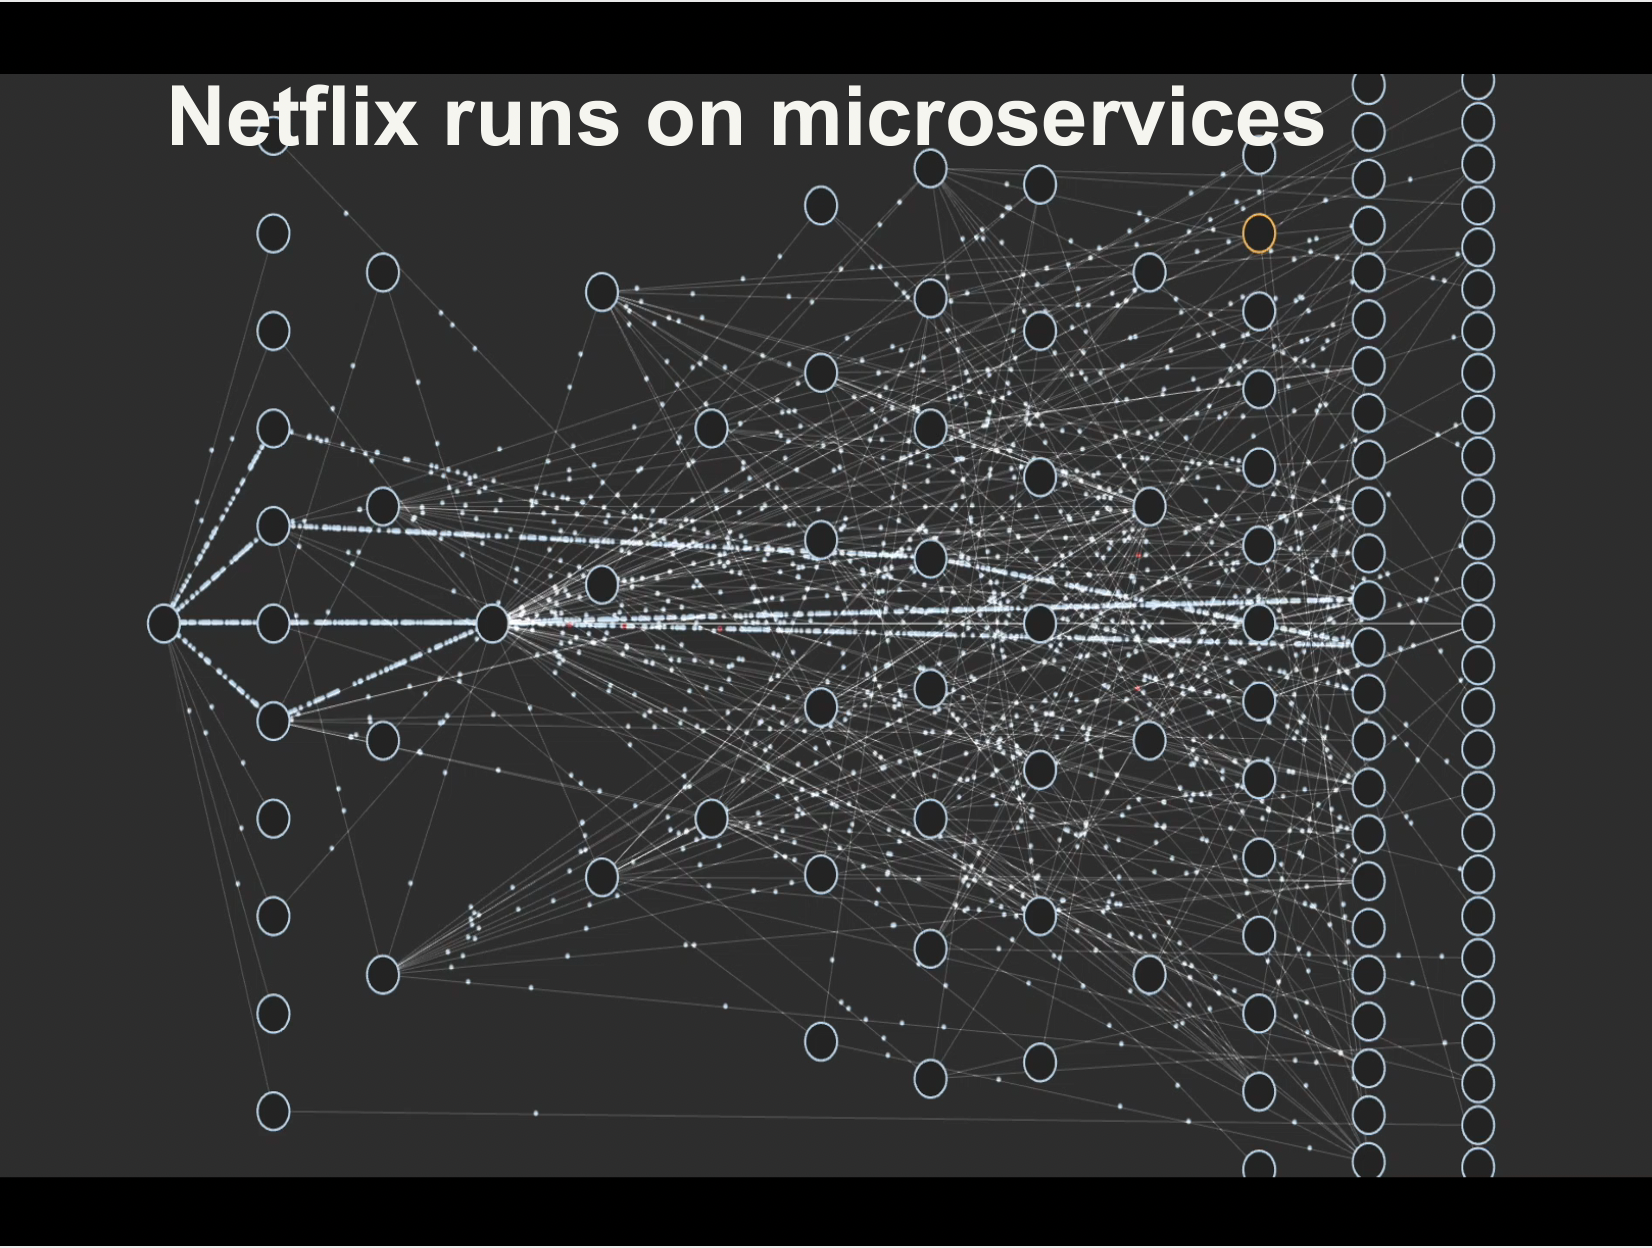
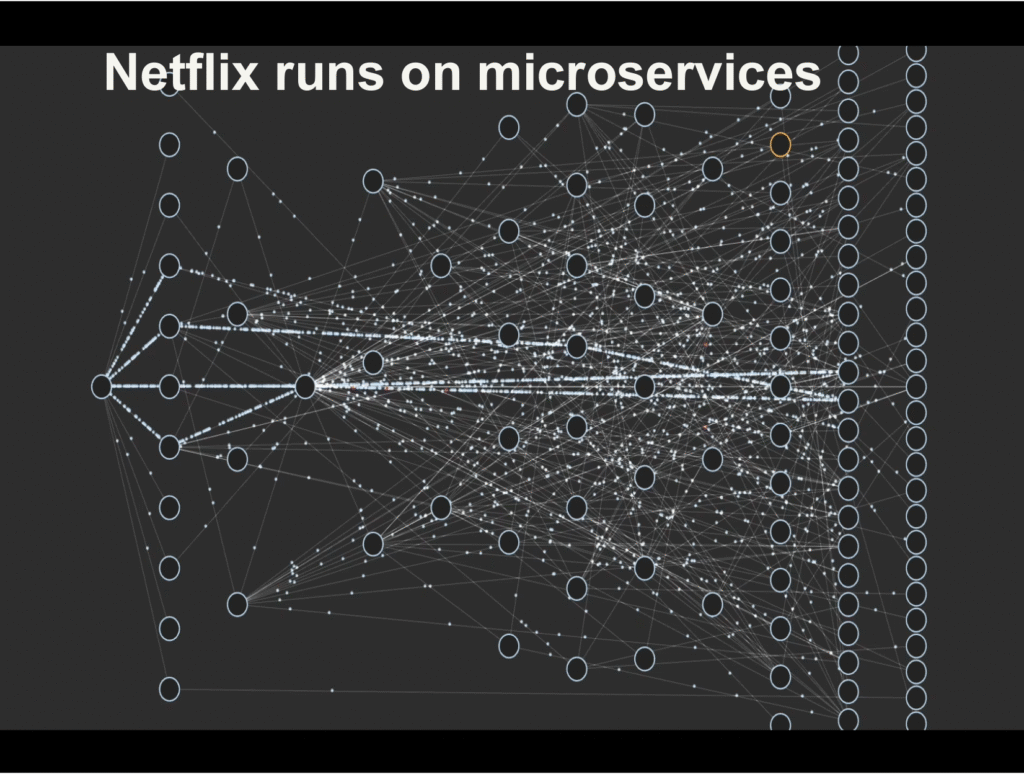
In recent years, the shift from monolithic architectures to microservices has become a popular trend in software development. This shift has been driven by the need to build more scalable, agile, and resilient systems, particularly in the context of modern cloud environments. In this article, we will explore the differences between monolithic and microservices architectures, the benefits and challenges of adopting microservices, and some best practices for making the transition successfully.
Monolithic Architecture
Monolithic architecture is a traditional way of building software applications where all the components of the system are tightly coupled together into a single codebase. The codebase usually consists of a single executable that includes all the functionality of the application. Monolithic applications typically have a layered architecture with a presentation layer, business logic layer, and data access layer. All the functionality of the application is implemented in these layers, and they are tightly coupled together.
Monolithic architecture has been the dominant approach for many years. It is relatively easy to develop and deploy, and it is straightforward to test and maintain. However, monolithic applications can become complex and unwieldy as they grow in size and complexity. Changes to one part of the application can have unintended consequences in other parts of the system, and this can make it challenging to introduce new features or make changes to the existing functionality.
Microservices Architecture
Microservices architecture is an alternative approach to building software applications. In a microservices architecture, the application is decomposed into a set of small, independent services that communicate with each other using APIs or message queues. Each service is responsible for a specific business capability, and it can be developed, deployed, and scaled independently of the other services in the system.
Microservices architecture provides several benefits over monolithic architecture. It allows for greater agility, as each service can be developed and deployed independently. This means that new features can be introduced more quickly, and changes to the existing functionality can be made without affecting the other parts of the system. Microservices also allow for greater scalability, as each service can be scaled independently based on its specific requirements. Additionally, microservices architecture can improve resilience, as failures in one service do not necessarily affect the other services in the system.
Benefits of Adopting Microservices
There are several benefits to adopting microservices architecture:
Greater agility: Microservices architecture allows for greater agility, as each service can be developed, deployed, and scaled independently. This means that new features can be introduced more quickly, and changes to the existing functionality can be made without affecting the other parts of the system.
Improved scalability: Microservices architecture allows for greater scalability, as each service can be scaled independently based on its specific requirements. This means that you can scale the parts of the system that need it most, without having to scale the entire system.
Better resilience: Microservices architecture can improve resilience, as failures in one service do not necessarily affect the other services in the system. This means that you can isolate failures and minimize their impact on the rest of the system.
Better fault isolation: Microservices architecture allows for better fault isolation, as failures in one service do not necessarily affect the other services in the system. This means that you can isolate failures and minimize their impact on the rest of the system.
Improved development velocity: Microservices architecture can improve development velocity, as each service can be developed independently. This means that you can introduce new features more quickly, and make changes to the existing functionality without affecting the other parts of the system.
Challenges of Adopting Microservices
Adopting microservices architecture can be challenging, and there are several key challenges that need to be addressed:
Complexity: Microservices architecture is more complex than monolithic architecture, as it involves multiple services communicating with each other. This can make the system more difficult to understand and manage.
Distributed systems: Microservices architecture involves building distributed systems, which can be more difficult to design, implement, and test than monolithic systems.
Operational overhead: Microservices architecture can increase operational overhead, as there are more services to deploy, manage, and monitor.
Inter-service communication: In a microservices architecture, services communicate with each other using APIs or message queues. This can introduce latency and increase the complexity of the system.
Data management: Microservices architecture can make data management more challenging, as data may be spread across multiple services.
Best Practices for Adopting Microservices
To successfully adopt microservices architecture, there are several best practices that should be followed:
Start small: Start with a small, well-defined service that can be developed, deployed, and tested quickly. This will allow you to get a feel for microservices architecture and identify any challenges early on.
Design for failure: In a microservices architecture, failures will happen. Design your system to be resilient to failures, and ensure that failures in one service do not affect the other services in the system.
Use API gateways: Use API gateways to manage the communication between services. This will make it easier to manage the system, and allow you to introduce new services more easily.
Automate everything: Automation is key to managing a microservices architecture at scale. Use automation tools to deploy, manage, and monitor your services.
Embrace DevOps: DevOps practices are essential for managing a microservices architecture. Embrace DevOps principles such as continuous integration, continuous delivery, and infrastructure as code.
Conclusion
The shift from monolithic architecture to microservices architecture is a trend that is likely to continue in the coming years. Microservices architecture offers several benefits over monolithic architecture, including greater agility, improved scalability, and better resilience. However, adopting microservices architecture can be challenging, and there are several key challenges that need to be addressed. By following best practices such as starting small, designing for failure, using API gateways, automating everything, and embracing DevOps, organizations can successfully make the transition from monolithic to microservices architecture and realize the benefits of this modern approach to building software applications.
Kubernetes is an open-source container orchestration platform that automates the deployment, scaling, and management of containerized applications. One of the key features of Kubernetes is the ability to perform zero downtime deployment, which means deploying a new version of an application without causing any disruption to end-users. In this blog post, we will explore the concept of zero downtime deployment in Kubernetes and how it can be achieved.
What is Zero Downtime Deployment?
Zero downtime deployment is the process of deploying a new version of an application without causing any downtime or service interruption. This means that end-users can continue to use the application without any interruption, even while the new version is being deployed. This is particularly important for applications that require high availability, as downtime can lead to loss of revenue and customer dissatisfaction.
How Kubernetes Achieves Zero Downtime Deployment
Kubernetes achieves zero downtime deployment through a technique called Rolling Updates. Rolling Updates allow Kubernetes to deploy new versions of an application gradually, one instance at a time, while keeping the existing instances running. This means that Kubernetes can update an application without taking it offline.
Rolling Updates work by creating a new ReplicaSet with the updated version of the application and gradually increasing the number of replicas in the new ReplicaSet while decreasing the number of replicas in the old ReplicaSet. This process continues until all replicas in the old ReplicaSet have been replaced by replicas in the new ReplicaSet. Once the process is complete, the old ReplicaSet is deleted, and the new ReplicaSet takes over.
To achieve zero downtime deployment, Kubernetes uses the following steps:
Create a new ReplicaSet: Kubernetes creates a new ReplicaSet with the updated version of the application.
Gradually increase the number of replicas in the new ReplicaSet: Kubernetes gradually increases the number of replicas in the new ReplicaSet, one instance at a time.
Gradually decrease the number of replicas in the old ReplicaSet: Kubernetes gradually decreases the number of replicas in the old ReplicaSet, one instance at a time.
Verify the health of the new ReplicaSet: Kubernetes verifies the health of the new ReplicaSet to ensure that all instances are running correctly.
Delete the old ReplicaSet: Once the new ReplicaSet has been fully deployed and verified, Kubernetes deletes the old ReplicaSet.
Example
here’s an example of how Kubernetes achieves zero downtime deployment:
Let’s say you have a web application running in Kubernetes with four instances, each serving user requests. You want to deploy a new version of the application without causing any downtime. Here’s how Kubernetes achieves this:
Create a new ReplicaSet: Kubernetes creates a new ReplicaSet with the updated version of the application.
                       +---+
New ReplicaSet (v2)    | 1 |
                       +---+
Gradually increase the number of replicas in the new ReplicaSet: Kubernetes starts creating new instances of the updated application in the new ReplicaSet, while keeping the old ReplicaSet running. At this point, you have four instances running in the old ReplicaSet and zero instances in the new ReplicaSet.
Gradually decrease the number of replicas in the old ReplicaSet: Kubernetes starts scaling down the old ReplicaSet, one instance at a time. For example, it may start by scaling down the old ReplicaSet to three instances and scaling up the new ReplicaSet to one instance. At this point, you have three instances running in the old ReplicaSet and one instance in the new ReplicaSet.
Verify the health of the new ReplicaSet: Kubernetes verifies the health of the new ReplicaSet to ensure that all instances are running correctly. If any issues arise, Kubernetes can stop the deployment and roll back to the previous version.
Continue scaling down the old ReplicaSet: Kubernetes continues scaling down the old ReplicaSet and scaling up the new ReplicaSet until all instances in the old ReplicaSet have been replaced by instances in the new ReplicaSet. At this point, you have zero instances running in the old ReplicaSet and four instances in the new ReplicaSet.
By using this process, Kubernetes can deploy new versions of an application gradually, one instance at a time, while keeping the existing instances running. This ensures that the application remains available to end-users during the deployment process, without causing any disruption to the user experience.
Benefits of Zero Downtime Deployment
Zero downtime deployment offers several benefits, including:
Increased availability: Zero downtime deployment ensures that the application remains available to end-users during the deployment process.
Reduced risk: By gradually deploying the new version of the application, Kubernetes reduces the risk of service disruption and enables quick rollback if issues arise.
Improved user experience: Zero downtime deployment ensures that end-users can continue to use the application without any interruption, leading to a better user experience.
Conclusion
Zero downtime deployment is a critical feature of Kubernetes that enables the deployment of new versions of an application without causing any disruption to end-users. Kubernetes achieves this through Rolling Updates, a technique that gradually deploys new versions of an application while keeping the existing instances running. By using zero downtime deployment, organizations can increase the availability of their applications, reduce risk, and improve the user experience.
The Certified Kubernetes Application Developer (CKAD) exam is designed to test your skills in developing and deploying applications on Kubernetes. If you are planning to take the CKAD exam, you may be wondering how to best prepare for it in a short amount of time. In this article, we will provide you with practical details on how to pass the CKAD exam in one month.
Understand the Exam Objectives
Before starting your preparation for the CKAD exam, it is crucial to understand the exam objectives. The CKAD exam tests your knowledge and skills in the following areas:
Core Kubernetes Concepts
Configuration
Multi-Container Pods
Observability
Pod Design
Services & Networking
State Persistence
Understanding the exam objectives will help you to focus your study efforts and create a study plan.
Create a Study Plan
To pass the CKAD exam in one month, you need to create a study plan that covers all the exam objectives. Here’s an example study plan:
Week 1:
Study Kubernetes core concepts, including Pods, Deployments, and Services.
Practice creating and managing Kubernetes objects.
Week 2:
Study Configuration and Multi-Container Pods, including ConfigMaps and Secrets.
Practice creating and managing Kubernetes objects.
Week 3:
Study Pod Design and Observability, including Liveness Probes and Logging.
Practice creating and managing Kubernetes objects.
Week 4:
Study Services & Networking, including Service Discovery and Network Policies.
Study State Persistence, including Persistent Volumes and Persistent Volume Claims.
Practice creating and managing Kubernetes objects.
Remember to schedule your study time around your work and personal commitments. It is also essential to take regular breaks to avoid burnout.
Practice, Practice, Practice
The key to passing the CKAD exam is practice. You need to practice creating and managing Kubernetes objects, troubleshooting common issues, and developing and deploying applications on Kubernetes.
There are several ways to practice for the CKAD exam:
Use the Kubernetes documentation – The Kubernetes documentation is an excellent resource for learning Kubernetes concepts and commands.
Use online labs – There are many online labs available that provide a Kubernetes environment for practicing.
Use practice exams – Practice exams can help you to familiarize yourself with the exam format and test your knowledge.
Join a study group – Joining a study group can provide you with support, motivation, and additional resources.
Useful Tips for the Exam Day
On the day of the exam, there are several things you can do to help you pass:
Get a good night’s sleep – Being well-rested will help you to stay focused during the exam.
Read the instructions carefully – Make sure you understand the instructions and requirements of each task.
Manage your time – The CKAD exam is a time-limited exam, so manage your time wisely.
Don’t panic – If you get stuck on a task, take a deep breath, and try to think logically about how to proceed.
Use the Kubernetes documentation – The Kubernetes documentation is available during the exam, so make use of it.
Conclusion
Passing the CKAD exam in one month is achievable with the right study plan and practice. Understanding the exam objectives, creating a study plan, and practicing regularly will help you to succeed. Remember to take regular breaks and use resources such as the Kubernetes documentation, online labs, and practice exams. On the day of the exam, stay calm, manage your time wisely, and use the available resources. Good luck!
The Certified Kubernetes Administrator (CKA) exam is a challenging certification that validates your Kubernetes skills and knowledge. If you’re preparing to take the CKA exam, you may be wondering how to best prepare for it in a short amount of time. In this article, we’ll provide you with practical details on how to pass the CKA exam in one month.
Understand the Exam Objectives
Before you start studying, it’s essential to understand the exam objectives. The CKA exam tests your knowledge and skills in the following areas:
Kubernetes core concepts
Kubernetes networking
Kubernetes scheduling
Kubernetes security
Kubernetes cluster maintenance
Kubernetes troubleshooting
Understanding the exam objectives will help you to focus your study efforts and create a study plan.
Create a Study Plan
To pass the CKA exam in one month, you’ll need to create a study plan that covers all the exam objectives. Here’s an example study plan:
Week 1:
Study Kubernetes core concepts, including Pods, Deployments, Services, and ConfigMaps.
Practice creating and managing Kubernetes objects.
Week 2:
Study Kubernetes networking, including Services, Ingress, and NetworkPolicies.
Practice creating and managing Kubernetes networking objects.
Week 3:
Study Kubernetes scheduling, including Nodes, Pods, and the Kubernetes Scheduler.
Practice creating and managing Kubernetes scheduling objects.
Week 4:
Study Kubernetes security, including Authentication, Authorization, and Admission Control.
Practice creating and managing Kubernetes security objects.
Study Kubernetes cluster maintenance and troubleshooting.
Practice troubleshooting common Kubernetes issues.
Remember to schedule your study time around your work and personal commitments. It’s also essential to take regular breaks to avoid burnout.
Practice, Practice, Practice
The key to passing the CKA exam is practice. You’ll need to practice creating and managing Kubernetes objects, troubleshooting common issues, and securing your Kubernetes cluster.
There are several ways to practice for the CKA exam:
Use the Kubernetes documentation – The Kubernetes documentation is an excellent resource for learning Kubernetes concepts and commands.
Use online labs – There are many online labs available that provide a Kubernetes environment for practicing.
Use practice exams – Practice exams can help you to familiarize yourself with the exam format and test your knowledge.
Join a study group – Joining a study group can provide you with support, motivation, and additional resources.
Useful Tips for the Exam Day
On the day of the exam, there are several things you can do to help you pass:
Get a good night’s sleep – Being well-rested will help you to stay focused during the exam.
Read the instructions carefully – Make sure you understand the instructions and requirements of each task.
Manage your time – The CKA exam is a time-limited exam, so manage your time wisely.
Don’t panic – If you get stuck on a task, take a deep breath, and try to think logically about how to proceed.
Use the Kubernetes documentation – The Kubernetes documentation is available during the exam, so make use of it.
Conclusion
Passing the CKA exam in one month is achievable with the right study plan and practice. Understanding the exam objectives, creating a study plan, and practicing regularly will help you to succeed. Remember to take regular breaks and use resources such as the Kubernetes documentation, online labs, and practice exams. On the day of the exam, stay calm, manage your time wisely, and use the available resources. Good luck!
Kubernetes is an open source container orchestration engine for automating deployment, scaling, and management of containerized applications. It’s supported by all hyperscaller cloud providers and widely used by different companies. Amazon, Google, IBM, Microsoft, Oracle, Red Hat, SUSE, Platform9, IONOS and VMware offer Kubernetes-based platforms or infrastructure as a service (IaaS) that deploy Kubernetes.
Pod
A Pod is the smallest Kubernetes deployable computing unit. It contains one or more containers with shared storage and network. Usually, Pods have a one-to-one relationship with containers. To scale up, we add more Pods and to scale down, we delete pods. We don’t add more containers to a pod for scaling purposes.
A Pod can have multiple containers with different types. We use a multi-container Pod when the application needs a helper container to run side by side with it. This helper container will be created when the application container is created and it will be deleted if the application container is deleted. They also share the same network (which means that they can communicate with each other using localhost) and same storage (using volumes).
We can create a pod using the following command,
$ kubectl run nginx --image nginx
create a Pod named nginx using the nginx docker image
This command will create a Pod named nginx using the nginx docker image available in docker-hub. To confirm the pod is created successfully, We can run the following command that will list pods in the default namespace,
$ kubectl get pods
NAME    READY   STATUS    RESTARTS   AGE
nginx   1/1     Running   0          15s
list pods in default namespace.
We also can create Pods using yaml configuration file,
This will deploy a logging agent alongside with our web app container to process the logs and send it to a central logging service for example. This pattern is called sidecar.
Replicaset
A replicaset ensures that the specified number of Pods (replicas) are running at all times. If a Pod goes down for any reason, It automatically creates a new one using the template specified in the yaml file. Here is an example replicaset definition file,
To create this repicaset, run the following command,
$ kubectl create -f nginx-replicaset.yaml
create nginx replicaset from yaml file
Note: In order for the replicaset to work, the spec.selector.matchLabelsmust match the spec.template.labels because the replicaset uses this template to create pods when needed.
Deployment
A Deployment is the recommended choice when it comes to deploy stateless applications in Kubernetes. It automatically creates a replicaset under the hood to ensure the specified number of Pods are running at all times. It also describe how to deploy a new version using deployment strategy, here is an example yaml definition file for a deployment,
To create this nginx Deployment, run the following command,
nginx-deploy.yaml redis-pod.yaml
create redis pod from yaml file
This will create a deployment named example-nginx-deploy using the nginx docker image available in docker-hub. To confirm the deployment is created successfully, We can run the following command that will list deployments in the default namespace,
$ kubectl get deploy
NAME                   READY   UP-TO-DATE   AVAILABLE   AGE
example-nginx-deploy   5/5     5            5           63s
list deployments in default namespace.
This will create a ReplicaSet under the hood to make sure all replicas are up all time,
$ kubectl get rs
NAME                             DESIRED   CURRENT   READY   AGE
example-nginx-deploy-bbc95f979   5         5         5       2m19s
list replicasets in default namespace.
It will also create 5 replicas using the same docker image specified in the yaml definition file, It uses the name of the deployment as a prefix for the name of the pod as shown below,
$ kubectl get pods
NAME                                   READY   STATUS    RESTARTS   AGE
example-nginx-deploy-bbc95f979-2g7kh   1/1     Running   0          97s
example-nginx-deploy-bbc95f979-dlq8l   1/1     Running   0          2m6s
example-nginx-deploy-bbc95f979-gb97h   1/1     Running   0          97s
example-nginx-deploy-bbc95f979-n6xdj   1/1     Running   0          97s
example-nginx-deploy-bbc95f979-pwphh   1/1     Running   0          97s
list pods in default namespace.
Note: In order for the deployment to work, the spec.selector.matchLabelsmust match the spec.template.labels because the deployment uses this template to create pods when the current number of pods doesn’t match the desired number of pods.
Scaling a Deployment
When creating a Deployment, We need to specify the number or replicas (default is one). Sometimes we need to scale up (increase the number of replicas) or scale down (decrease the number of replicas) manually. We can do this by running the following commands:
Scaling up example-nginx-deply from 5 replicas to 10 replicas:
The main point of using a deployment in Kubernetes is that we can easily deploy a new version of our application using the deployment strategy defined in the deployment and we can also roll it back easily if this new version didn’t work as expected with zero downtime.
We use .spec.strategy to specify how we want to deploy this new version. We have two types of deployment strategies, Recreate and RollingUpdate. RollingUpdate is the default value.
Recreate Deployment Strategy means that all current pods with the old version will be killed and new pods will be created using the new version. This will cause the application to be down for sometime (depends on how long it takes to start the app). This is not the preferred option because of the downtime.
RollingUpdate Deployment Strategy means that it will run both versions (the old and new one) for sometime until the deployment is completed. based on the .spec.strategy.rollingUpdate.maxUnavailable and .spec.strategy.rollingUpdate.maxSurge values, it will create new pods with the new version and delete old pods with the old version. if we configured this correctly, we can assure that the deployment is zero downtime deployment.
In this example deployment, we have ten replicas and RollingUpdate strategy with maxSurge is 30% (it can also be an absolute number) which means that this deployment can run 30% more replicas if needed (instead of creating 10 replicas, it can create 13 replicas temporary for both old and new versions) and maxUnavailable is 20% (it can also be an absolute number) which is the maximum number of unavailable pods during the update process (20% of ten replicas is two pods)
The default value for maxSurge and maxUnavailable is 25%.
Rollout and Rollback a Deployment
To deploy a new version of a deployment we use the following command,
$ kubectl set image deployment/example-nginx-deploy nginx-container=nginx:1.16.1 --record
deployment.apps/example-nginx-deploy image updated
deploy nginx 1.16.1
Note: The record flag is deprecated but there is no alternative to it yet. for more info check this.
To check the status of the deployment,
$ kubectl rollout status deployment/example-nginx-deploy
Waiting for deployment "example-nginx-deploy" rollout to finish: 3 out of 5 new replicas have been updated...
Waiting for deployment "example-nginx-deploy" rollout to finish: 3 out of 5 new replicas have been updated...
Waiting for deployment "example-nginx-deploy" rollout to finish: 3 out of 5 new replicas have been updated...
Waiting for deployment "example-nginx-deploy" rollout to finish: 3 out of 5 new replicas have been updated...
Waiting for deployment "example-nginx-deploy" rollout to finish: 3 out of 5 new replicas have been updated...
Waiting for deployment "example-nginx-deploy" rollout to finish: 4 out of 5 new replicas have been updated...
Waiting for deployment "example-nginx-deploy" rollout to finish: 4 out of 5 new replicas have been updated...
Waiting for deployment "example-nginx-deploy" rollout to finish: 4 out of 5 new replicas have been updated...
Waiting for deployment "example-nginx-deploy" rollout to finish: 4 out of 5 new replicas have been updated...
Waiting for deployment "example-nginx-deploy" rollout to finish: 4 out of 5 new replicas have been updated...
Waiting for deployment "example-nginx-deploy" rollout to finish: 2 old replicas are pending termination...
Waiting for deployment "example-nginx-deploy" rollout to finish: 2 old replicas are pending termination...
Waiting for deployment "example-nginx-deploy" rollout to finish: 2 old replicas are pending termination...
Waiting for deployment "example-nginx-deploy" rollout to finish: 1 old replicas are pending termination...
Waiting for deployment "example-nginx-deploy" rollout to finish: 1 old replicas are pending termination...
Waiting for deployment "example-nginx-deploy" rollout to finish: 1 old replicas are pending termination...
Waiting for deployment "example-nginx-deploy" rollout to finish: 4 of 5 updated replicas are available...
deployment "example-nginx-deploy" successfully rolled out
check the status of the rollout
As you can see from the logs, it first created two pods with the new version. Once they are up and running it starts to terminate old pods (using old version) and create new pods (using new version) one by one to make sure the application is up and running at all times.
we can see this more clearly from the deployment events,
$ kubectl describe deployments


Name:                   example-nginx-deploy
Namespace:              default
CreationTimestamp:      Sun, 18 Sep 2022 11:42:41 +0200
Labels:                 app=example-nginx-deploy
Annotations:            deployment.kubernetes.io/revision: 2
Selector:               app=example-nginx-deploy
Replicas:               5 desired | 5 updated | 5 total | 5 available | 0 unavailable
StrategyType:           RollingUpdate
MinReadySeconds:        0
RollingUpdateStrategy:  20% max unavailable, 30% max surge
Pod Template:
  Labels:  app=example-nginx-deploy
  Containers:
   nginx:
    Image:        nginx:1.16.1
    Port:         <none>
    Host Port:    <none>
    Environment:  <none>
    Mounts:       <none>
  Volumes:        <none>
Conditions:
  Type           Status  Reason
  ----           ------  ------
  Available      True    MinimumReplicasAvailable
  Progressing    True    NewReplicaSetAvailable
OldReplicaSets:  <none>
NewReplicaSet:   example-nginx-deploy-78788d9bbd (5/5 replicas created)
Events:
  Type    Reason             Age    From                   Message
  ----    ------             ----   ----                   -------
  Normal  ScalingReplicaSet  8m13s  deployment-controller  Scaled up replica set example-nginx-deploy-78788d9bbd to 2
  Normal  ScalingReplicaSet  8m13s  deployment-controller  Scaled down replica set example-nginx-deploy-bbc95f979 to 4
  Normal  ScalingReplicaSet  8m13s  deployment-controller  Scaled up replica set example-nginx-deploy-78788d9bbd to 3
  Normal  ScalingReplicaSet  4m57s  deployment-controller  Scaled down replica set example-nginx-deploy-bbc95f979 to 3
  Normal  ScalingReplicaSet  4m57s  deployment-controller  Scaled up replica set example-nginx-deploy-78788d9bbd to 4
  Normal  ScalingReplicaSet  4m53s  deployment-controller  Scaled down replica set example-nginx-deploy-bbc95f979 to 2
  Normal  ScalingReplicaSet  4m53s  deployment-controller  Scaled up replica set example-nginx-deploy-78788d9bbd to 5
  Normal  ScalingReplicaSet  4m49s  deployment-controller  Scaled down replica set example-nginx-deploy-bbc95f979 to 1
  Normal  ScalingReplicaSet  4m46s  deployment-controller  Scaled down replica set example-nginx-deploy-bbc95f979 to 0
Let’s say nginx 1.16.1 is a buggy version and we want to rollback to the previous version. First we need to check the rollout history,
kubectl rollout history deployment/example-nginx-deploy
deployment.apps/example-nginx-deploy
REVISION  CHANGE-CAUSE
1         <none>
3         kubectl set image deployment/example-nginx-deploy nginx=nginx:1.14.2 --record=true
4         kubectl set image deployment/example-nginx-deploy nginx=nginx:1.16.1 --record=true
To rollback to previous version, Run the following command,
kubectl rollout undo deployment/example-nginx-deploy
deployment.apps/example-nginx-deploy rolled back
rollback to nginx 1.14.2
Conclusion
A Pod is the smallest Kubernetes deployable computing unit. It contains one or more containers with shared storage and network. A replicaset ensures that the specified number of Pods (replicas) are running at all times. If a Pod goes down for any reason, It automatically creates a new one using the template specified in the yaml file. A Deployment is the recommended choice when it comes to deploy stateless applications in Kubernetes. It automatically creates a replicaset under the hood to ensure the specified number of Pods are running at all times. It can be easily scaled up or down using kubectl scale command. It also enables us to easily rollout a new version of our application using the specified deployment strategy and rollback to previous version if needed.
Kubernetes is an open source container orchestration engine for automating deployment, scaling, and management of containerized applications. It’s supported by all hyperscaller cloud providers and widely used by different companies. Amazon, Google, IBM, Microsoft, Oracle, Red Hat, SUSE, Platform9, IONOS and VMware offer Kubernetes-based platforms or infrastructure as a service (IaaS) that deploy Kubernetes.
Vertical Scaling
Vertical scaling means increasing the amount of CPU and Ram that’s used by a single instance of your application.
For example, if we deployed our application to a virtual machine (or an EC2 instance) with 8 Gib of Ram and 1 CPUs, and our application is getting more traffic, we can vertically scale the app by increasing the Ram to 16 Gib and adding one more CPU.
A drawback to this approach is that it has limits. at some point you won’t be able to scale more. That’s why we need horizontal scaling as well.
Horizontal Scaling
Horizontal scaling means increasing the number of instances that run your application.
For example, if we deployed our application to a virtual machine (or an EC2 instance), and our application is getting more traffic, we can horizontally scale the app by adding one more instance and use a load balancer to split the traffic between them.
If you are using a cloud provider (like AWS), theoretically, you can add an unlimited number of instances (of course it’s going to cost some money).
Why do we need Autoscaling?
Autoscaling means automatically scaling your application, horizontally or vertically, based on a metric(s) like CPU or memory utilization without human intervention.
We need autoscaling because we want to respond to increasing traffic as quickly as possible. We also want to save money and run as few instances with as little resources as possible.
In Kubernetes, We use Vertical Pod Autoscaler (VPA) and Horizontal Pod Autoscaler (HPA) to achieve autoscaling.
Install the metrics server
For Horizontal Pod Autoscaler and Vertical Pod Autoscaler to work, we need to install the metrics server in our cluster. It collects resource metrics from Kubelets and exposes them in Kubernetes apiserver through Metrics API. Metrics API can also be accessed by kubectl top, making it easier to debug autoscaling pipelines.
This should return all metrics for pods in kube-system namespace.
Vertical Pod Autoscaler
Vertical Pod Autoscaler (VPA) allows you to increase or decrease your pods’ resources (RAM and CPU) based on a selected metric. The Vertical Pod Autoscaler ( VPA ) can suggest the Memory/CPU requests and Limits. It can also automatically update the Memory/CPU requests and Limits if this is enabled by the user. This will reduce the time taken by the engineers running the Performance/Benchmark testing to determine the correct values for CPU and memory requests/limits.
VPA doesn’t come with kubernetes by default so we need to install it first,
$ git clone https://github.com/kubernetes/autoscaler.git
$ cd autoscaler/vertical-pod-autoscaler/
$ ./hack/vpa-up.sh
$ kubectl get po -n kube-system | grep -i vpa

NAME READY STATUS RESTARTS AGE
vpa-admission-controller-dklptmn43-44klm 1/1 Running 0 1m11s
vpa-recommender-prllenmca-gjf53 1/1 Running 0 1m50s
vpa-updater-ldee3597h-fje44 1/1 Running 0 1m48s
install VPA
Example
Create a redis deployment and request too much memory and cpu.
As you can see, VPA definition file consists of three parts,
targetRef which defines the target of this VPA. It should match the deployment we created earlier.
updatePolicy it tells the VPA how to update the target resource
resourcePolicy, optional. This allow us to be more flexible by defining minimum and maximum resources for a container or to run of autoscaling for a specific container using containerPolicies
VPA update Policy
Here are all valid options for updateMode in VPA:
Off – VPA will only provide the recommendations, then we need to apply them manually if we want to. This is best if we want to use VPA just to give us an idea how much resources our application needs.
Initial – VPA only assigns resource requests on pod creation and never changes them later. It will still provide us with recommendations.
Recreate – VPA assigns resource requests on pod creation time and updates them on existing pods by evicting and recreating them.
Auto – It automatically recreates the pod based on the recommendation. It’s best to use PodDisruptionBudget to ensure that the one replica of our deployment is up at all the time without any restarts. This will eventually ensure that our application is available and consistent. For more information please check this.
Horizontal Pod Autoscaler
Horizontal Pod Autoscaling (HPA) that allows you to increase or decrease the number of pods in a deployment automatically based on a selected metric. HPA comes with kubernetes by default.
Example
Create an nginx deployment and make sure you define resources request and limits,
This HPA will use CPU utilization to scale the deployment. If it’s more than 55%, it will scale up. If it’s less than 55%, it will scale down. To create the HPA, we need to run the following command:
$ kubectl create -f example-nginx-hpa.yaml
create nginx deployment
There are a lot more configurations we can use to make our HPA more stable and useful. Here’s an example with common configuration:
In this example, we use CPU and Memory Utilization. There’s also the possibility to add more metrics if we want. We also defined scaleUp and scaleDown behaviors to tell kubernetes how we want to do it. For more info please check this.
Custom metrics
In some applications, scaling based on memory or CPU utilization is not that important, probably it does some blocking tasks (live calling external API) which doesn’t consume much resources. In this case, scaling based on the number of requests makes more sense.
Since we are using autoscaling/v2 API version, We can configure a HPA to scale based on a custom metric (that is not built in to Kubernetes or any Kubernetes component). The HPA controller then queries for these custom metrics from the Kubernetes API.
Conclusion
Autoscaling is a powerful feature. It allows us to easily adopt our application to handle load change automatically without any human intervention. We can use VerticalPodAutoscaler to help us determine the resources needed for our application. We also can use HPA to add or remove replicas dynamically based on CPU or/and memory utilization. It’s also possible to scale based on a custom metric like RPS (number of requests per second) or number of messages in a queue if we use event driven architecture.
Kubernetes is an open source container orchestration engine for automating deployment, scaling, and management of containerized applications. It’s supported by all hyperscaller cloud providers and widely used by different companies. Amazon, Google, IBM, Microsoft, Oracle, Red Hat, SUSE, Platform9, IONOS and VMware offer Kubernetes-based platforms or infrastructure as a service (IaaS) that deploy Kubernetes.
What is a prope in Kubernetes?
A Prope is a health check that is triggered by the kublet to automatically determine if a pod can accept traffic or not. There are four options
httpGet: HTTP check based on the response status code. Any code greater than or equal to 200 and less than 400 indicates success. Any other code indicates failure.
exec: Check the command’s exit status. If it’s zero (0), it indicates success otherwise it’s considered failure.
tcpSocket: The kubelet will attempt to open a TCP socket connection to your container on the specified port. If it connects successfully, the container is considered healthy, otherwise it’s a failure.
grpc: The kubelet will use gRPC health checking protocol to check if your container is able to handle RPC calls or not.
Prope common fields
initialDelaySeconds: Number of seconds after the container has started before the probes are initiated. Defaults to zero (0) seconds.
periodSeconds: How often (in seconds) to perform the probe. Default to 10 seconds.
timeoutSeconds: Number of seconds after which the probe times out. Defaults to 1 second.
successThreshold: Minimum consecutive successes for the probe to be considered successful after having failed. Defaults to 1. Must be 1 for liveness and startup Probes.
failureThreshold: When a probe fails, Kubernetes will try failureThreshold times before giving up. Defaults to 3.
Startup Prope
A startup probe verifies whether the application within a container is started. It runs before any other probe, and, unless it finishes successfully, disables other probes. If a container fails its startup probe, then the container is killed and follows the pod’s restartPolicy.
This type of probe is only executed at startup, unlike readiness probes, which are run periodically.
The startup probe is configured in the spec.containers.startupprobe attribute of the pod configuration.
Readiness Prope
A readiness prope verifies whether the application within a container is ready to accept traffic. If it fails for failureThreshold times, the pod will be restarted. It is configured in the spec.containers.readinessprobe attribute of the pod configuration.
Liveness Prope
A liveness prope verifies whether the application within a container is healthy. If it fails for failureThreshold times, the pod will be killed and restarted. It is configured in the spec.containers.livenessprobe attribute of the pod configuration.
Examples
Here is a deployment that uses startup, readiness and liveness http propes:
Kubernetes deployment uses startup, readiness and liveness http propes.
In this example, We use different endpoint for readiness and liveness propes. This is the best practice because in the readiness prope, we might need to check all dependencies are up which might take some time and resources but in the liveness prope, since it’s called periodically, we want to get a response as quickly as possible to respond to deadlock fast.
Here is a deployment that uses readiness exec prope and liveness tcpSocket prope:
Using readiness and liveness propes is recommended to enable kubernetes to start sending traffic to your container only when it’s ready to handle them. It also helps your application to recover automatically when a deadlock occurs but you need to configure your readiness or liveness prope correctly because it might cause your application to never start if the failureThreshold is too low for example. it also might cause your application to take long time when restarting if the initialDelaySeconds or periodSeconds are too high.