How to deploy an application so that it works well at large scale? Of course there is no easy answer for such a question. It probably would take an entire book to explain that. Fortunately, in Site Reliability Engineering book, Google explained briefly what it might be like.
They explained how to deploy sample service in the Google production environment. This will give us more insights on how complex it might get if we would deploy a simple service to serve millions of users around the world.
Suppose we want to offer a service that lets you determine where a given word is used throughout all of Shakespeare’s works. It’s a typical search problem which means that it can be divided into two components:
Indexing and writing the index into a Bigtable. This can be run once or frequently based on the problem (in Shakespeare’s case, it’s enough to run it once). This can be implemented using MapReduce (scroll down for a simpler example of MapReduce task) which will split Shakespeare’s work (text) into hundreds of parts, assign each part to a worker, all workers should run in parallel then they will send the results to a reducer task which will create a tuple of (word, list of locations) and write it to a row in a Bigtable, using the word as the key.
A frontend application for users to be able to search for words and see the results.
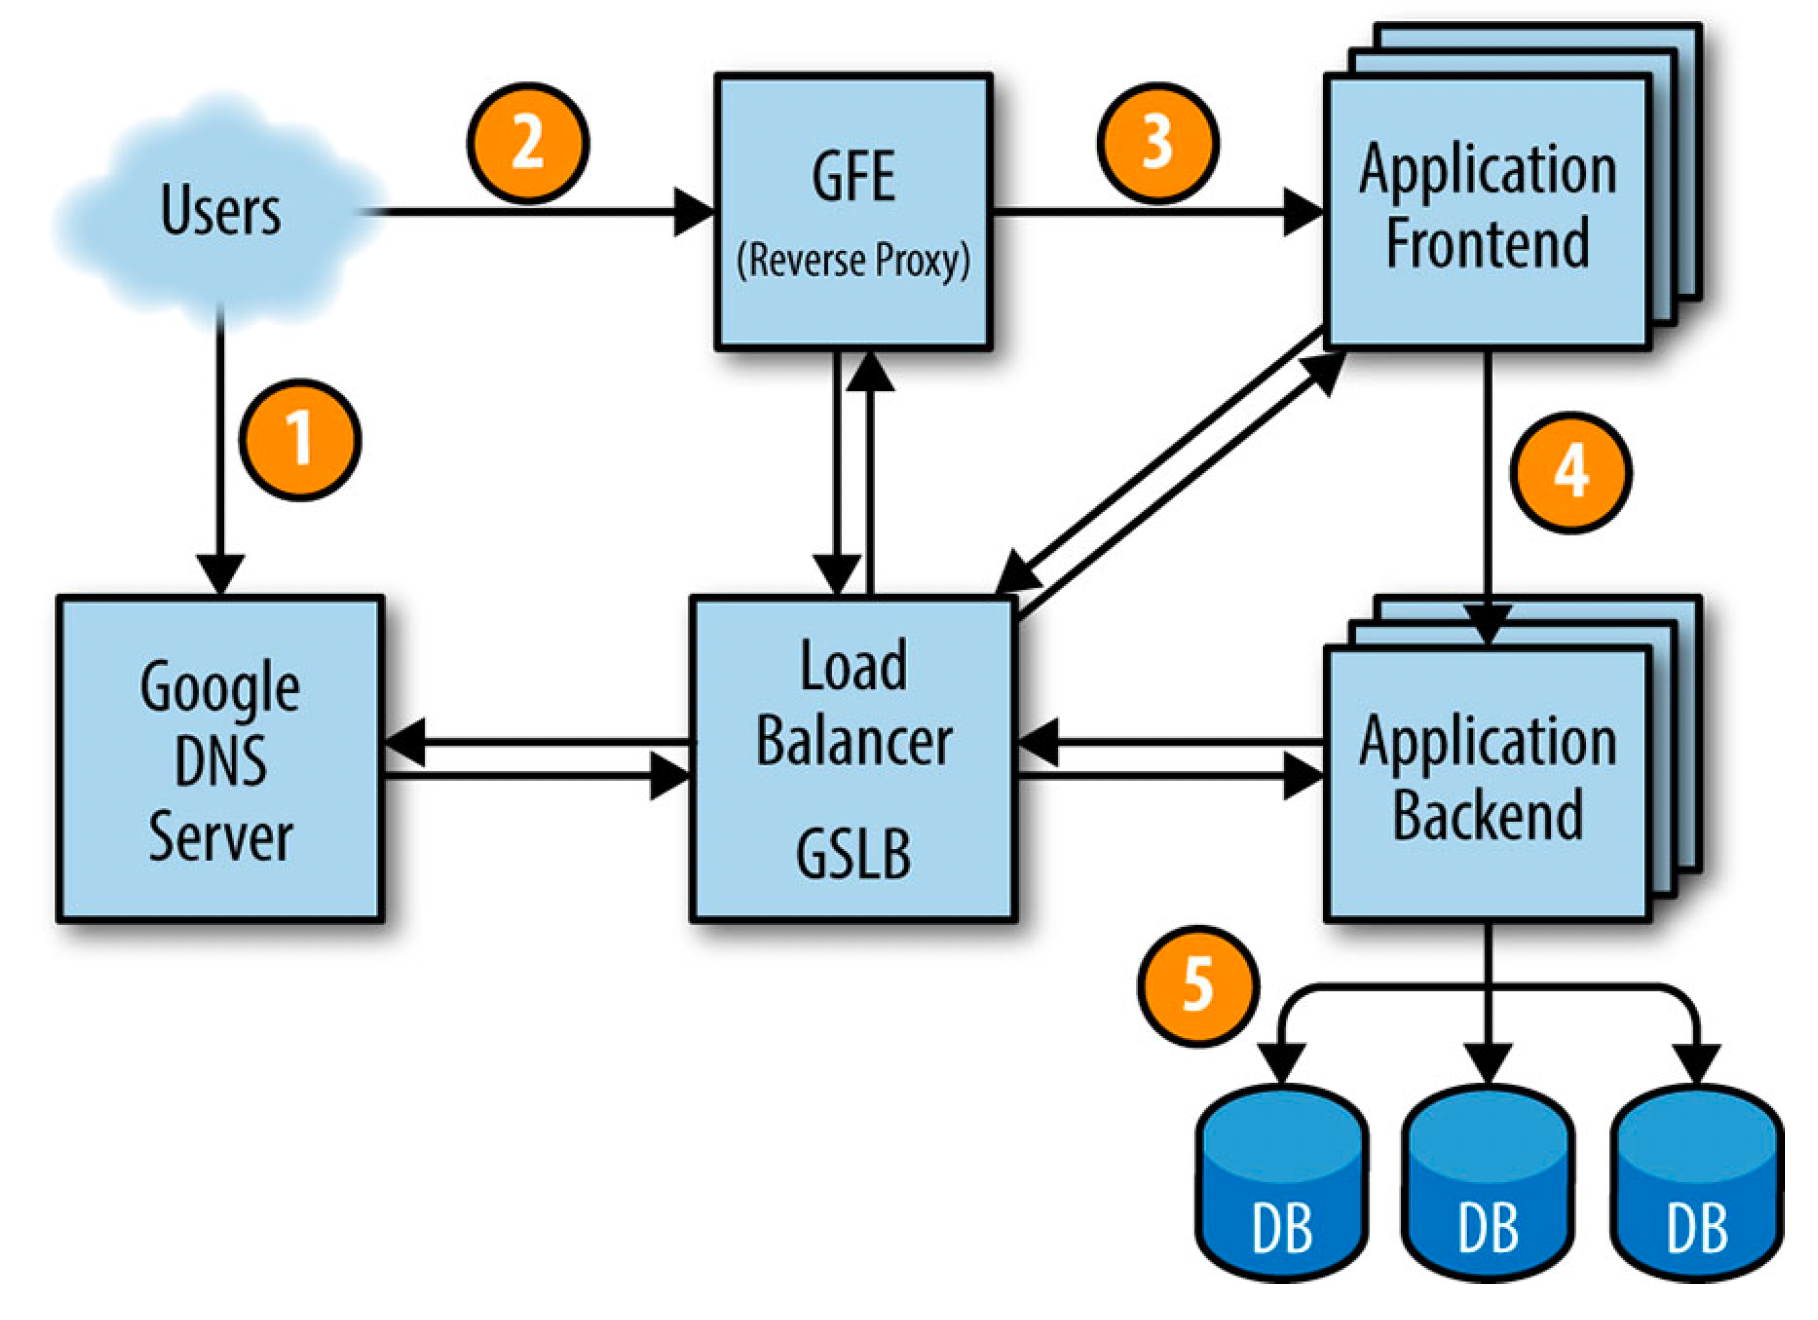
Here is how a user request will be served:
how a user request will be served
First, the user goes to shakespeare.google.com to obtain the corresponding IP address from Google’s DNS server, which talks to GSLB to pick which server IP address to send to this user. The browser connects to the HTTP server on this IP. This server (named the Google Frontend, or GFE) is a reverse proxy that terminates the TCP connection (2).
The GFE looks up which service is required (web search, maps, or—in this case—Shakespeare). Again using GSLB, the server finds an available Shakespeare frontend server, and sends that server an RPC containing the HTTP request (3).
The Shakespeare frontend server now needs to contact the Shakespeare backend server: The frontend server contacts GSLB to obtain the BNS address of a suitable and unloaded backend server (4).
That Shakespeare backend server now contacts a Bigtable server to obtain the requested data (5).
The answer is returned to the Shakespeare backend server. The backend hands the results to the Shakespeare frontend server, which assembles the HTML and returns the answer to the user.
This entire chain of events is executed in the blink of an eye—just a few hundred milliseconds! Because many moving parts are involved, there are many potential points of failure; in particular, a failing GSLB would break the entire application. How can we protect our application from single point of failure and make it more reliable? That’s what will be covered in the next section.
Ensuring Reliability
Let’s assume we did load testing for our infrastructure and found that one backend server can handle about 100 queries per second (QPS). Let’s also assume that it’s expected to get about 3500 QPS as a peak load, so we need at least 35 replicas of the backend server. But actually we need 37 tasks in the job, or N+2 because:
During updates, one task at a time will be unavailable, leaving 36 tasks.
A machine failure might occur during a task update, leaving only 35 tasks, just enough to serve peak load.
A closer examination of user traffic shows our peak usage is distributed globally:
1,430 QPS from North America,
290 QPS from South America,
1,400 QPS from Europe and Africa,
350 QPS from Asia and Australia.
Instead of locating all backends at one site, we distribute them across the USA, South America, Europe, and Asia. Allowing for N+2 redundancy per region means that we end up with
17 tasks in the USA,
16 in Europe,
6 in Asia,
5 in South America
However, we decided to use 4 tasks (instead of 5) in South America, to lower the overhead of N+2 to N+1. In this case, we’re willing to tolerate a small risk of higher latency in exchange for lower hardware costs. If GSLB redirects traffic from one continent to another when our South American datacenter is over loaded, we can save 20% of the resources we’d spend on hardware. In the larger regions, we’ll spread tasks across two or three clusters for extra resiliency.
Because the backends need to contact the Bigtable holding the data, we need to also design this storage element strategically. A backend in Asia contacting a Bigtable in the USA adds a significant amount of latency, so we replicate the Bigtable in each region. Bigtable replication helps us in two ways:
It provides resilience when a Bigtable server fail
It lowers data-access latency.
Conclusion
This was just a quick introduction about how it would be like to design a reliable system. Of course the reality is much more complicated than this. Next we will take a deeper look at some SRE terminologies and how to implement them in our organisations.
An simpler example of MapReduce
This is a very simple example of MapReduce. No matter the amount of data you need to analyze, the key principles remain the same.
Assume you have ten CSV files with three columns (date, city, temperature). We want to find the maximum temperature for each city across the data files (note that each file might have the same city represented multiple times).
Using the MapReduce framework, we can break this down into ten map tasks, where each mapper works on one of the files. The mapper task goes through the data and returns the maximum temperature for each city.
For example, (Cairo, 45) (Berlin, 32) (Porto, 33) (Rome, 36)
After all map tasks are done, the output streams would be fed into the reduce tasks, which combine the input results and output a single value for each city, producing a final result.
For example, (Cairo, 46) (Berlin, 32) (Porto, 38) (Rome, 36), Barcelona (40), ..
A friend tweeted about something or shared a story on instagram about her latest trip to Rome or started a new job or got laid off or starting a new relationship or moving to a new city or or or… . There are an indefinite number of things that happen around us everyday and we are getting a notification about all of them. This consumes lots of our time and energy then when it comes to do things that matter for us, things that will affect our life in a positive way if we really did it well (like working or spending time with our families), It becomes really hard to achieve our goals. It becomes hard to complete the tasks assigned to us or to be present when spending time with friends or family.
We are living in a very noisy world that’s full of distractions. That’s why reading has become more challenging these days. It’s challenging for me too. I am not someone who reads tens of books every year. I am just a normal guy who really struggles to read a book every few months. I believe there are lots of people like me who really want to read but it’s not that easy for them. I decided to change that.
In 2023, I decided to start my book summary series. I will simply read books and share summaries of these books with you.
I will start with a very interesting book that I read in 2020 and I really enjoyed it a lot. It’s `Site Reliability Engineering` by Google. I believe this is a must read for all Software Engineers, Product Managers, Engineering Managers, QA Engineers, pretty much anyone who works in the software industry. It’s available for free from here if you prefer to read it online or here if you prefer a pdf version.
For those who doesn’t know what SRE is, here is the ChatGPT answer to this question:
Site Reliability Engineering (SRE) is a discipline that combines software engineering and IT operations to ensure that software systems are reliable, scalable, and available. SRE teams are responsible for designing, building, and maintaining systems to meet the needs of their users.
The goal of SRE is to improve the reliability and performance of software systems by applying engineering principles and practices to the tasks of IT operations. This includes automating processes, monitoring systems, and implementing tools and processes to improve the reliability and efficiency of software systems.
SRE teams often work closely with developers to ensure that software is designed and implemented in a way that is easy to operate and maintain. They also work with IT operations teams to ensure that systems are reliable and available to users. SRE teams may also be responsible for incident response and problem resolution, as well as implementing changes and updates to systems.
Observability is a measure of how well we can understand and explain any state our system can get into, no matter how weird it is. We must be able to debug that strange state across all dimensions of system state data, and combinations of dimensions, in an ad hoc iterative investigation, without being required to define or predict those debugging needs in advance. If we can understand any bizarre or novel state without needing to ship new code, we have observability.
Observability alone is not the entire solution to all of software engineering problems. But it does help clearly see what’s happening in all the corners of our software, where we are otherwise typically stumbling around in the dark and trying to understand things.
A production software system is observable if we can understand new internal system states without having to make random guesses, predict those failure modes in advance, or ship new code to understand that state.
Why Are Metrics and Monitoring Not Enough?
Monitoring and metrics-based tools were built with certain assumptions about the architecture and organisation, assumptions that served in practice as a cap on complexity. These assumptions are usually invisible until we exceed them, at which point they cease to be hidden and become the bane of our ability to understand what’s happening. Some of these assumptions might be as follows:
Our application is a monolith.
There is one stateful data store (“the database”), which we run.
Many low-level system metrics are available (e.g., resident memory, CPU load average).
The application runs on containers, virtual machines (VMs), or bare metal, which we control.
System metrics and instrumentation metrics are the primary source of information for debugging code.
We have a fairly static and long-running set of nodes, containers, or hosts to monitor.
Engineers examine systems for problems only after problems occur.
Dashboards and telemetry exist to serve the needs of operations engineers.
Monitoring examines “black-box” applications in much the same way as local applications.
The focus of monitoring is uptime and failure prevention.
Examination of correlation occurs across a limited (or small) number of dimensions.
When compared to the reality of modern systems, it becomes clear that traditional monitoring approaches fall short in several ways. The reality of modern systems is as follows:
The application has many services.
There is polyglot persistence (i.e., different databases and storage systems).
Infrastructure is extremely dynamic, with capacity flicking in and out of existence elastically.
Many far-flung and loosely coupled services are managed, many of which are not directly under our control.
Engineers actively check to see how changes to production code behave, in order to catch tiny issues early, before they create user impact.
Automatic instrumentation is insufficient for understanding what is happening in complex systems.
Software engineers own their own code in production and are incentivized to proactively instrument their code and inspect the performance of new changes as they’re deployed.
The focus of reliability is on how to tolerate constant and continuous degradation, while building resiliency to user-impacting failures by utilizing constructs like error budget, quality of service, and user experience.
Examination of correlation occurs across a virtually unlimited number of dimensions.
The last point is important, because it describes the breakdown that occurs between the limits of correlated knowledge that one human can be reasonably expected to think about and the reality of modern system architectures. So many possible dimensions are involved in discovering the underlying correlations behind performance issues that no human brain, and in fact no schema, can possibly contain them.
With observability, comparing high-dimensionality and high-cardinality data becomes a critical component of being able to discover otherwise hidden issues buried in complex system architectures.
Distributed tracing and Why it matters?
Distributed tracing is a method of tracking the propagation of a single request – called a trace – as it’s handled by various services that make up an application. Tracing in that sense is “distributed” because in order to fulfill its function, a single request must often traverse process, machine and network boundaries.
Traces help understand system interdependencies. Those interdependencies can obscure problems and make them particularly difficult to debug unless the relationships between them are clearly understood. For example, if a database service experiences performance bottlenecks, that latency can cumulatively stack up. By the time that latency is detected three or four layers upstream, identifying which component of the system is the root of the problem can be incredibly difficult because now that same latency is being seen in dozens of other services.
Instrumentation with OpenTelemetry
OpenTelemetry is an open-source CNCF (Cloud Native Computing Foundation) project formed from the merger of the OpenCensus and OpenTracing projects. It provides a collection of tools, APIs, and SDKs for capturing metrics, distributed traces and logs from applications.
With OTel (short for OpenTelemetry), we can instrument our application code only once and send our telemetry data to any backend system of our choice (like Jaeger).
Automatic instrumentation
For this purpose, OTel includes automatic instrumentation to minimize the time to first value for users. Because OTel’s charter is to ease adoption of the cloud native eco-system and microservices, it supports the most common frameworks for interactions between services. For example, OTel automatically generates trace spans for incoming and outgoing grpc, http, and database/cache calls from instrumented services. This will provide us with at least the skeleton of who calls whom in the tangled web of microservices and downstream dependencies.
To implement that automatic instrumentation of request properties and timings, the frameworks needs to call OTel before and after handling each request. Thus, common frameworks often support wrappers, interceptors, or middleware that OTel can hook into in order to automatically read context propagation metadata and create spans for each request.
Custom instrumentation
Once we have automatic instrumentation, we have a solid foundation for making an investment in custom instrumentation specific to our business logic. We can attach fields and rich values, such as user IDs, brands, platforms, errors, and more to the auto-instrumented spans inside our code. These annotations make it easier in the future to understand what’s happening at each layer.
By adding custom spans within our application for particularly expensive, time-consuming steps internal to our process, we can go beyond the automatically instrumented spans for outbound calls to dependencies and get visibility into all areas of our code. This type of custom instrumentation is what will help you practice observability-driven development, where we create instrumentation alongside new features in our code so that we can verify it operates as we expect in production in real time as it is being released.
Adding custom instrumentation to our code helps us work proactively to make future problems easier to debug by providing full context – that includes business logic – around a particular code execution path.
Exporting telemetry data to a backend system
After creating telemetry data by using the preceding methods, we’ll want to send it somewhere. OTel supports two primary methods for exporting data from our process to an analysis backend, we can proxy it through the openTelemetry collector or we can export it directly from our process to the backend.
Exporting directly from our process requires us to import, depend on and instantiate one or more exporters. Exporters are libraries that translate OTel’s in-memory span and metric objects into the appropriate format for various telemetry analysis tools.
Exporters are instantiated once, on program start-up, usually in the main function.
Typically, we’ll need to emit telemetry to only one specific backend. However, OTel allows us to arbitrarily instantiate and configure many exporters, allowing our system to emit the same telemetry to more than one telemetry sink at the same time. One possible use case for exporting to multiple telemetry sinks might be to ensure uninterrupted access to our current production observability tool, while using the same telemetry data to test the capabilities of a different observability tool we’re evaluating.
Conclusion
Monitoring is best suited to evaluate the health of your systems. Observability is best suited to evaluate the health of your software.
OTel is an open source standard that enables you to send telemetry data to any number of backend data stores you choose. OTel is a new vendor-neutral approach to ensure that you can instrument your application to emit telemetry data regardless of which observability system you choose.
Kubernetes is an open source container orchestration engine for automating deployment, scaling, and management of containerized applications. It’s supported by all hyperscaller cloud providers and widely used by different companies. Amazon, Google, IBM, Microsoft, Oracle, Red Hat, SUSE, Platform9, IONOS and VMware offer Kubernetes-based platforms or infrastructure as a service (IaaS) that deploy Kubernetes.
Pod
A Pod is the smallest Kubernetes deployable computing unit. It contains one or more containers with shared storage and network. Usually, Pods have a one-to-one relationship with containers. To scale up, we add more Pods and to scale down, we delete pods. We don’t add more containers to a pod for scaling purposes.
A Pod can have multiple containers with different types. We use a multi-container Pod when the application needs a helper container to run side by side with it. This helper container will be created when the application container is created and it will be deleted if the application container is deleted. They also share the same network (which means that they can communicate with each other using localhost) and same storage (using volumes).
We can create a pod using the following command,
$ kubectl run nginx --image nginx
create a Pod named nginx using the nginx docker image
This command will create a Pod named nginx using the nginx docker image available in docker-hub. To confirm the pod is created successfully, We can run the following command that will list pods in the default namespace,
$ kubectl get pods
NAME    READY   STATUS    RESTARTS   AGE
nginx   1/1     Running   0          15s
list pods in default namespace.
We also can create Pods using yaml configuration file,
This will deploy a logging agent alongside with our web app container to process the logs and send it to a central logging service for example. This pattern is called sidecar.
Replicaset
A replicaset ensures that the specified number of Pods (replicas) are running at all times. If a Pod goes down for any reason, It automatically creates a new one using the template specified in the yaml file. Here is an example replicaset definition file,
To create this repicaset, run the following command,
$ kubectl create -f nginx-replicaset.yaml
create nginx replicaset from yaml file
Note: In order for the replicaset to work, the spec.selector.matchLabelsmust match the spec.template.labels because the replicaset uses this template to create pods when needed.
Deployment
A Deployment is the recommended choice when it comes to deploy stateless applications in Kubernetes. It automatically creates a replicaset under the hood to ensure the specified number of Pods are running at all times. It also describe how to deploy a new version using deployment strategy, here is an example yaml definition file for a deployment,
To create this nginx Deployment, run the following command,
nginx-deploy.yaml redis-pod.yaml
create redis pod from yaml file
This will create a deployment named example-nginx-deploy using the nginx docker image available in docker-hub. To confirm the deployment is created successfully, We can run the following command that will list deployments in the default namespace,
$ kubectl get deploy
NAME                   READY   UP-TO-DATE   AVAILABLE   AGE
example-nginx-deploy   5/5     5            5           63s
list deployments in default namespace.
This will create a ReplicaSet under the hood to make sure all replicas are up all time,
$ kubectl get rs
NAME                             DESIRED   CURRENT   READY   AGE
example-nginx-deploy-bbc95f979   5         5         5       2m19s
list replicasets in default namespace.
It will also create 5 replicas using the same docker image specified in the yaml definition file, It uses the name of the deployment as a prefix for the name of the pod as shown below,
$ kubectl get pods
NAME                                   READY   STATUS    RESTARTS   AGE
example-nginx-deploy-bbc95f979-2g7kh   1/1     Running   0          97s
example-nginx-deploy-bbc95f979-dlq8l   1/1     Running   0          2m6s
example-nginx-deploy-bbc95f979-gb97h   1/1     Running   0          97s
example-nginx-deploy-bbc95f979-n6xdj   1/1     Running   0          97s
example-nginx-deploy-bbc95f979-pwphh   1/1     Running   0          97s
list pods in default namespace.
Note: In order for the deployment to work, the spec.selector.matchLabelsmust match the spec.template.labels because the deployment uses this template to create pods when the current number of pods doesn’t match the desired number of pods.
Scaling a Deployment
When creating a Deployment, We need to specify the number or replicas (default is one). Sometimes we need to scale up (increase the number of replicas) or scale down (decrease the number of replicas) manually. We can do this by running the following commands:
Scaling up example-nginx-deply from 5 replicas to 10 replicas:
The main point of using a deployment in Kubernetes is that we can easily deploy a new version of our application using the deployment strategy defined in the deployment and we can also roll it back easily if this new version didn’t work as expected with zero downtime.
We use .spec.strategy to specify how we want to deploy this new version. We have two types of deployment strategies, Recreate and RollingUpdate. RollingUpdate is the default value.
Recreate Deployment Strategy means that all current pods with the old version will be killed and new pods will be created using the new version. This will cause the application to be down for sometime (depends on how long it takes to start the app). This is not the preferred option because of the downtime.
RollingUpdate Deployment Strategy means that it will run both versions (the old and new one) for sometime until the deployment is completed. based on the .spec.strategy.rollingUpdate.maxUnavailable and .spec.strategy.rollingUpdate.maxSurge values, it will create new pods with the new version and delete old pods with the old version. if we configured this correctly, we can assure that the deployment is zero downtime deployment.
In this example deployment, we have ten replicas and RollingUpdate strategy with maxSurge is 30% (it can also be an absolute number) which means that this deployment can run 30% more replicas if needed (instead of creating 10 replicas, it can create 13 replicas temporary for both old and new versions) and maxUnavailable is 20% (it can also be an absolute number) which is the maximum number of unavailable pods during the update process (20% of ten replicas is two pods)
The default value for maxSurge and maxUnavailable is 25%.
Rollout and Rollback a Deployment
To deploy a new version of a deployment we use the following command,
$ kubectl set image deployment/example-nginx-deploy nginx-container=nginx:1.16.1 --record
deployment.apps/example-nginx-deploy image updated
deploy nginx 1.16.1
Note: The record flag is deprecated but there is no alternative to it yet. for more info check this.
To check the status of the deployment,
$ kubectl rollout status deployment/example-nginx-deploy
Waiting for deployment "example-nginx-deploy" rollout to finish: 3 out of 5 new replicas have been updated...
Waiting for deployment "example-nginx-deploy" rollout to finish: 3 out of 5 new replicas have been updated...
Waiting for deployment "example-nginx-deploy" rollout to finish: 3 out of 5 new replicas have been updated...
Waiting for deployment "example-nginx-deploy" rollout to finish: 3 out of 5 new replicas have been updated...
Waiting for deployment "example-nginx-deploy" rollout to finish: 3 out of 5 new replicas have been updated...
Waiting for deployment "example-nginx-deploy" rollout to finish: 4 out of 5 new replicas have been updated...
Waiting for deployment "example-nginx-deploy" rollout to finish: 4 out of 5 new replicas have been updated...
Waiting for deployment "example-nginx-deploy" rollout to finish: 4 out of 5 new replicas have been updated...
Waiting for deployment "example-nginx-deploy" rollout to finish: 4 out of 5 new replicas have been updated...
Waiting for deployment "example-nginx-deploy" rollout to finish: 4 out of 5 new replicas have been updated...
Waiting for deployment "example-nginx-deploy" rollout to finish: 2 old replicas are pending termination...
Waiting for deployment "example-nginx-deploy" rollout to finish: 2 old replicas are pending termination...
Waiting for deployment "example-nginx-deploy" rollout to finish: 2 old replicas are pending termination...
Waiting for deployment "example-nginx-deploy" rollout to finish: 1 old replicas are pending termination...
Waiting for deployment "example-nginx-deploy" rollout to finish: 1 old replicas are pending termination...
Waiting for deployment "example-nginx-deploy" rollout to finish: 1 old replicas are pending termination...
Waiting for deployment "example-nginx-deploy" rollout to finish: 4 of 5 updated replicas are available...
deployment "example-nginx-deploy" successfully rolled out
check the status of the rollout
As you can see from the logs, it first created two pods with the new version. Once they are up and running it starts to terminate old pods (using old version) and create new pods (using new version) one by one to make sure the application is up and running at all times.
we can see this more clearly from the deployment events,
$ kubectl describe deployments


Name:                   example-nginx-deploy
Namespace:              default
CreationTimestamp:      Sun, 18 Sep 2022 11:42:41 +0200
Labels:                 app=example-nginx-deploy
Annotations:            deployment.kubernetes.io/revision: 2
Selector:               app=example-nginx-deploy
Replicas:               5 desired | 5 updated | 5 total | 5 available | 0 unavailable
StrategyType:           RollingUpdate
MinReadySeconds:        0
RollingUpdateStrategy:  20% max unavailable, 30% max surge
Pod Template:
  Labels:  app=example-nginx-deploy
  Containers:
   nginx:
    Image:        nginx:1.16.1
    Port:         <none>
    Host Port:    <none>
    Environment:  <none>
    Mounts:       <none>
  Volumes:        <none>
Conditions:
  Type           Status  Reason
  ----           ------  ------
  Available      True    MinimumReplicasAvailable
  Progressing    True    NewReplicaSetAvailable
OldReplicaSets:  <none>
NewReplicaSet:   example-nginx-deploy-78788d9bbd (5/5 replicas created)
Events:
  Type    Reason             Age    From                   Message
  ----    ------             ----   ----                   -------
  Normal  ScalingReplicaSet  8m13s  deployment-controller  Scaled up replica set example-nginx-deploy-78788d9bbd to 2
  Normal  ScalingReplicaSet  8m13s  deployment-controller  Scaled down replica set example-nginx-deploy-bbc95f979 to 4
  Normal  ScalingReplicaSet  8m13s  deployment-controller  Scaled up replica set example-nginx-deploy-78788d9bbd to 3
  Normal  ScalingReplicaSet  4m57s  deployment-controller  Scaled down replica set example-nginx-deploy-bbc95f979 to 3
  Normal  ScalingReplicaSet  4m57s  deployment-controller  Scaled up replica set example-nginx-deploy-78788d9bbd to 4
  Normal  ScalingReplicaSet  4m53s  deployment-controller  Scaled down replica set example-nginx-deploy-bbc95f979 to 2
  Normal  ScalingReplicaSet  4m53s  deployment-controller  Scaled up replica set example-nginx-deploy-78788d9bbd to 5
  Normal  ScalingReplicaSet  4m49s  deployment-controller  Scaled down replica set example-nginx-deploy-bbc95f979 to 1
  Normal  ScalingReplicaSet  4m46s  deployment-controller  Scaled down replica set example-nginx-deploy-bbc95f979 to 0
Let’s say nginx 1.16.1 is a buggy version and we want to rollback to the previous version. First we need to check the rollout history,
kubectl rollout history deployment/example-nginx-deploy
deployment.apps/example-nginx-deploy
REVISION  CHANGE-CAUSE
1         <none>
3         kubectl set image deployment/example-nginx-deploy nginx=nginx:1.14.2 --record=true
4         kubectl set image deployment/example-nginx-deploy nginx=nginx:1.16.1 --record=true
To rollback to previous version, Run the following command,
kubectl rollout undo deployment/example-nginx-deploy
deployment.apps/example-nginx-deploy rolled back
rollback to nginx 1.14.2
Conclusion
A Pod is the smallest Kubernetes deployable computing unit. It contains one or more containers with shared storage and network. A replicaset ensures that the specified number of Pods (replicas) are running at all times. If a Pod goes down for any reason, It automatically creates a new one using the template specified in the yaml file. A Deployment is the recommended choice when it comes to deploy stateless applications in Kubernetes. It automatically creates a replicaset under the hood to ensure the specified number of Pods are running at all times. It can be easily scaled up or down using kubectl scale command. It also enables us to easily rollout a new version of our application using the specified deployment strategy and rollback to previous version if needed.
Kubernetes is an open source container orchestration engine for automating deployment, scaling, and management of containerized applications. It’s supported by all hyperscaller cloud providers and widely used by different companies. Amazon, Google, IBM, Microsoft, Oracle, Red Hat, SUSE, Platform9, IONOS and VMware offer Kubernetes-based platforms or infrastructure as a service (IaaS) that deploy Kubernetes.
Vertical Scaling
Vertical scaling means increasing the amount of CPU and Ram that’s used by a single instance of your application.
For example, if we deployed our application to a virtual machine (or an EC2 instance) with 8 Gib of Ram and 1 CPUs, and our application is getting more traffic, we can vertically scale the app by increasing the Ram to 16 Gib and adding one more CPU.
A drawback to this approach is that it has limits. at some point you won’t be able to scale more. That’s why we need horizontal scaling as well.
Horizontal Scaling
Horizontal scaling means increasing the number of instances that run your application.
For example, if we deployed our application to a virtual machine (or an EC2 instance), and our application is getting more traffic, we can horizontally scale the app by adding one more instance and use a load balancer to split the traffic between them.
If you are using a cloud provider (like AWS), theoretically, you can add an unlimited number of instances (of course it’s going to cost some money).
Why do we need Autoscaling?
Autoscaling means automatically scaling your application, horizontally or vertically, based on a metric(s) like CPU or memory utilization without human intervention.
We need autoscaling because we want to respond to increasing traffic as quickly as possible. We also want to save money and run as few instances with as little resources as possible.
In Kubernetes, We use Vertical Pod Autoscaler (VPA) and Horizontal Pod Autoscaler (HPA) to achieve autoscaling.
Install the metrics server
For Horizontal Pod Autoscaler and Vertical Pod Autoscaler to work, we need to install the metrics server in our cluster. It collects resource metrics from Kubelets and exposes them in Kubernetes apiserver through Metrics API. Metrics API can also be accessed by kubectl top, making it easier to debug autoscaling pipelines.
This should return all metrics for pods in kube-system namespace.
Vertical Pod Autoscaler
Vertical Pod Autoscaler (VPA) allows you to increase or decrease your pods’ resources (RAM and CPU) based on a selected metric. The Vertical Pod Autoscaler ( VPA ) can suggest the Memory/CPU requests and Limits. It can also automatically update the Memory/CPU requests and Limits if this is enabled by the user. This will reduce the time taken by the engineers running the Performance/Benchmark testing to determine the correct values for CPU and memory requests/limits.
VPA doesn’t come with kubernetes by default so we need to install it first,
$ git clone https://github.com/kubernetes/autoscaler.git
$ cd autoscaler/vertical-pod-autoscaler/
$ ./hack/vpa-up.sh
$ kubectl get po -n kube-system | grep -i vpa

NAME READY STATUS RESTARTS AGE
vpa-admission-controller-dklptmn43-44klm 1/1 Running 0 1m11s
vpa-recommender-prllenmca-gjf53 1/1 Running 0 1m50s
vpa-updater-ldee3597h-fje44 1/1 Running 0 1m48s
install VPA
Example
Create a redis deployment and request too much memory and cpu.
As you can see, VPA definition file consists of three parts,
targetRef which defines the target of this VPA. It should match the deployment we created earlier.
updatePolicy it tells the VPA how to update the target resource
resourcePolicy, optional. This allow us to be more flexible by defining minimum and maximum resources for a container or to run of autoscaling for a specific container using containerPolicies
VPA update Policy
Here are all valid options for updateMode in VPA:
Off – VPA will only provide the recommendations, then we need to apply them manually if we want to. This is best if we want to use VPA just to give us an idea how much resources our application needs.
Initial – VPA only assigns resource requests on pod creation and never changes them later. It will still provide us with recommendations.
Recreate – VPA assigns resource requests on pod creation time and updates them on existing pods by evicting and recreating them.
Auto – It automatically recreates the pod based on the recommendation. It’s best to use PodDisruptionBudget to ensure that the one replica of our deployment is up at all the time without any restarts. This will eventually ensure that our application is available and consistent. For more information please check this.
Horizontal Pod Autoscaler
Horizontal Pod Autoscaling (HPA) that allows you to increase or decrease the number of pods in a deployment automatically based on a selected metric. HPA comes with kubernetes by default.
Example
Create an nginx deployment and make sure you define resources request and limits,
This HPA will use CPU utilization to scale the deployment. If it’s more than 55%, it will scale up. If it’s less than 55%, it will scale down. To create the HPA, we need to run the following command:
$ kubectl create -f example-nginx-hpa.yaml
create nginx deployment
There are a lot more configurations we can use to make our HPA more stable and useful. Here’s an example with common configuration:
In this example, we use CPU and Memory Utilization. There’s also the possibility to add more metrics if we want. We also defined scaleUp and scaleDown behaviors to tell kubernetes how we want to do it. For more info please check this.
Custom metrics
In some applications, scaling based on memory or CPU utilization is not that important, probably it does some blocking tasks (live calling external API) which doesn’t consume much resources. In this case, scaling based on the number of requests makes more sense.
Since we are using autoscaling/v2 API version, We can configure a HPA to scale based on a custom metric (that is not built in to Kubernetes or any Kubernetes component). The HPA controller then queries for these custom metrics from the Kubernetes API.
Conclusion
Autoscaling is a powerful feature. It allows us to easily adopt our application to handle load change automatically without any human intervention. We can use VerticalPodAutoscaler to help us determine the resources needed for our application. We also can use HPA to add or remove replicas dynamically based on CPU or/and memory utilization. It’s also possible to scale based on a custom metric like RPS (number of requests per second) or number of messages in a queue if we use event driven architecture.
Kubernetes is an open source container orchestration engine for automating deployment, scaling, and management of containerized applications. It’s supported by all hyperscaller cloud providers and widely used by different companies. Amazon, Google, IBM, Microsoft, Oracle, Red Hat, SUSE, Platform9, IONOS and VMware offer Kubernetes-based platforms or infrastructure as a service (IaaS) that deploy Kubernetes.
What is a prope in Kubernetes?
A Prope is a health check that is triggered by the kublet to automatically determine if a pod can accept traffic or not. There are four options
httpGet: HTTP check based on the response status code. Any code greater than or equal to 200 and less than 400 indicates success. Any other code indicates failure.
exec: Check the command’s exit status. If it’s zero (0), it indicates success otherwise it’s considered failure.
tcpSocket: The kubelet will attempt to open a TCP socket connection to your container on the specified port. If it connects successfully, the container is considered healthy, otherwise it’s a failure.
grpc: The kubelet will use gRPC health checking protocol to check if your container is able to handle RPC calls or not.
Prope common fields
initialDelaySeconds: Number of seconds after the container has started before the probes are initiated. Defaults to zero (0) seconds.
periodSeconds: How often (in seconds) to perform the probe. Default to 10 seconds.
timeoutSeconds: Number of seconds after which the probe times out. Defaults to 1 second.
successThreshold: Minimum consecutive successes for the probe to be considered successful after having failed. Defaults to 1. Must be 1 for liveness and startup Probes.
failureThreshold: When a probe fails, Kubernetes will try failureThreshold times before giving up. Defaults to 3.
Startup Prope
A startup probe verifies whether the application within a container is started. It runs before any other probe, and, unless it finishes successfully, disables other probes. If a container fails its startup probe, then the container is killed and follows the pod’s restartPolicy.
This type of probe is only executed at startup, unlike readiness probes, which are run periodically.
The startup probe is configured in the spec.containers.startupprobe attribute of the pod configuration.
Readiness Prope
A readiness prope verifies whether the application within a container is ready to accept traffic. If it fails for failureThreshold times, the pod will be restarted. It is configured in the spec.containers.readinessprobe attribute of the pod configuration.
Liveness Prope
A liveness prope verifies whether the application within a container is healthy. If it fails for failureThreshold times, the pod will be killed and restarted. It is configured in the spec.containers.livenessprobe attribute of the pod configuration.
Examples
Here is a deployment that uses startup, readiness and liveness http propes:
Kubernetes deployment uses startup, readiness and liveness http propes.
In this example, We use different endpoint for readiness and liveness propes. This is the best practice because in the readiness prope, we might need to check all dependencies are up which might take some time and resources but in the liveness prope, since it’s called periodically, we want to get a response as quickly as possible to respond to deadlock fast.
Here is a deployment that uses readiness exec prope and liveness tcpSocket prope:
Using readiness and liveness propes is recommended to enable kubernetes to start sending traffic to your container only when it’s ready to handle them. It also helps your application to recover automatically when a deadlock occurs but you need to configure your readiness or liveness prope correctly because it might cause your application to never start if the failureThreshold is too low for example. it also might cause your application to take long time when restarting if the initialDelaySeconds or periodSeconds are too high.
This is a step by step tutorial for beginners on how to write a python command line tool to fetch data from a remote API. This will teach you how to write clean, maintainable, testable and easy to use code in python.
The point of this tutorial is mainly to learn how to structure the code in a way that it’s easy to extend in the future and also easy to understand and test.
The requirements
Implement a CLI that fetches public holidays from the existing API, https://date.nager.at, and shows the next n (5 by default) occurring holidays.
In order to avoid fetching the data too frequently, the endpoint shouldn’t be called more than once a day. To achieve that, we need to implement caching. There are many different ways to do that. I chose to use Redis because it’s really powerful, fast, reliable and widely used in many applications.
The country code should be passed as a cli argument.
The output should contain the following information: Date, name, counties, types.
Building CLI
Argparse is the default python module for creating command line tools. It provides all the features you need to build a simple CLI. It can work for our example but i find it a little bit complicated and not very pythonic that’s why i chose another one called click. It’s a Python package for creating beautiful command line interfaces in a composable way with as little code as necessary. It uses decorators to define commands.
You can install it using pip:
$ python -m pip install -U click
To define a command using click, the command needs to be a function wrapped with the decorator @click.command():
We need to add two arguments to this command, the country code which is a string and the number of upcoming vacation days to display, which is an integer and the default value is five. to do this, we need to use the decorator @click.option as follows:
import click


@click.command()
@click.option(
    "--country-code",
    prompt="Country Code",
    help="Country code. complete list is here https://date.nager.at/Country."
)
@click.option(
    "--max-num",
    prompt="Max num of holidays returned",
    help="Max num of holidays returned.",
    default=5,
)
def main(country_code, max_num=5):
    """
    Simple CLI for getting the Public holidays of a country by country code.
    """
    click.echo(f"country_code: {country_code}, max_num: {max_num}")
    click.echo("It works.")


if __name__ == "__main__":
    main()
Now our command is ready. Let’s start with the second step, using docker.
Using docker
Docker is a software platform that allows you to build, test, and deploy applications quickly. Docker packages software into containers that have everything the software needs to run. Using Docker helps deploy and scale applications into any environment and be sure that your code will run without any installation problem.
To dockerize our command we need to create a Dockerfile. It’s a text document containing the instructions that docker should follow to build the docker image (using docker build) which is used to run the docker container later.
here is our Dockerfile:
# use python3.9 base image
FROM python:3.9

# defining the working directory
WORKDIR /code

# copy the requirements.txt from the local directory to the docker image
ADD ./requirements.txt /code/requirements.txt

# upgrade pip setuptools
RUN pip install --upgrade setuptools wheel

# install all dependencies from requirements.txt file
RUN pip install -r requirements.txt
Dockerfile
Using docker-compose
Docker compose is a tool that uses yaml files to define multiple container applications (like this one). Docker compose can be used in all environments but it’s not recommended to use it in production. It’s recommended to use docker swarm which is very similar to docker-compose or even better use kubernetes.
We need to run multiple containers because we need to have a caching layer in our command line tool to cache the holidays for one day. we will use Redis for that but let’s first start by setting up the redis container and make it available to our command line tool.
Here is the docker-compose.yaml file for redis. it defines one service called redis and uses redis:alpine image which is available in docker hub
We also need to add our command line tool to the docker-compose file to be able to run the command and start the redis container with only one command. here is how can we do it
version: '3.7'

services:
  command:
    # build the local Dockerfile image and use it here
    build: .

    # command to start the container
    command: python main.py --country-code DE --max-num 5

    # volume to mount the code inside the docker-container
    volumes:
      - .:/code

    # this container should not start until redis container is up
    depends_on:
      - redis
  redis:
    image: "redis:alpine"
Here we added another service called command which uses the docker image from the docker file we already implemented previously and the command to start this container is just python main.py. it also depends on redis which means that the command container should not start until the redis container is up.
Now you should be able to run the command and start the redis server by just running:
docker-compose up
Configuring the cache
The next step is to configure the caching layer and start using it in our command line tool. The first step is to install redis using pip. also make sure to add it to the requirements.txt.
$ python -m pip install redis
Then create a new file called cache.py. This should contain the following code
from redis import StrictRedis


# settings from url redis://{host}:{port}
# the host is the name of redis service we defined in the docker-compose file
REDIS_URL = 'redis://redis:6379'


redis_conn = StrictRedis.from_url(REDIS_URL)
cache.py
This will create a connection to the redis server using the singleton design pattern because we need to make sure that we only have one connection and we are re-using this connection instead of creating a new connection each time we want to communicate to the redis server.
The next step is to create some helper functions to handle the common use cases of the cache like caching some data, retrieving some data from cache and also invalidating the cache if needed.
import json
from datetime import datetime
from typing import Optional

from redis import StrictRedis


# settings
REDIS_URL = 'redis://redis:6379'
LAST_UPDATED_AT_KEY_POSTFIX = '_last_updated_at'
DEFAULT_CACHE_IN_SECONDS = 86400  # 1 day


redis_conn = StrictRedis.from_url(REDIS_URL)


def get_data_from_cache(key: str) -> Optional[dict]:
    """
    retrieve data from cache for the given key
    """
    data = redis_conn.get(key)
    if data:
        return json.loads(data)


def save_data_to_cache(key: str, data: dict, expire_in_sec: int = DEFAULT_CACHE_IN_SECONDS) -> None:
    """
    Save data to cache
    """
    redis_conn.set(key, json.dumps(data), ex=expire_in_sec)
    redis_conn.set(key + LAST_UPDATED_AT_KEY_POSTFIX, datetime.now().strftime('%Y-%m-%d %H:%M:%S'), ex=expire_in_sec)


def invalidate_cache_for_key(key: str) -> None:
    """
    invalidate cache for the given key
    """
    redis_conn.delete(key)
    redis_conn.delete(key + LAST_UPDATED_AT_KEY_POSTFIX)
cache.py
Now the caching layer is ready for us to use in the command line. As you can see, all we need to do to save some data to the cache is to import and use the save_data_to_cache function without worrying much about which caching solution we use or how to connect to it. Also, if we decided for some reason to change the caching backend to use memcache for example, all we need to do is to change the cache.py file and make sure our helper functions work. no need to change anything in the application.
Holidays Client
The next step is to implement the Holidays Client that will allow us to fetch holidays from an external API.
First we need to install requests. It’s a very common HTTP library. Requests allows you to send HTTP/1.1 requests extremely easily. There’s no need to manually add query strings to your URLs, or to form-encode your PUT & POST data.
To install it,
$ python -m pip install requests
Then create a new file called client.py. We will first implement the base class HolidaysClient that will define all attributes and methods we need to implement the client. It does not matter which backend we use to fetch the holidays, it will always use this class as a parent class and implement the get_holidays method.
import abc


class HolidaysClient(abc.ABC):
    """
    Abstract class to be used as a base class to any endpoint for getting the public holidays.
    """
    # Base url for the external endpoint
    BASE_URL = None

    def get_holidays(self, country_code: str, year: int) -> dict:
        """
        getting the holidays from external API by country code and year
        """
        raise NotImplemented()
Then we need to implement the NagerHolidaysClient that inherits from HolidaysClient and implement the get_holidays method using date.nager.at PublicHolidays API.
import abc

import requests


class HolidaysClient(abc.ABC):
    """
    Abstract class to be used as a base class to any endpoint for getting the public holidays.
    """
    # Base url for the external endpoint
    BASE_URL = None

    def get_holidays(self, country_code: str, year: int) -> dict:
        """
        getting the holidays from external API by country code and year
        """
        raise NotImplemented()


class NagerHolidaysClient(HolidaysClient):
    """
    Nager client to get holidays from date.nager.at
    """
    # base url of nager client
    BASE_URL = 'https://date.nager.at'

    def get_holidays(self, country_code: str, year: int) -> dict:
        """
        fetch holidays from date.nager.at using PublicHolidays API
        """
        url = f'{self.BASE_URL}/api/v3/PublicHolidays/{year}/{country_code}'
        response = requests.get(url)
        response.raise_for_status()
        response_data = response.json()
        return response_data
Now the client should be ready. The next step will be adding some usecases and utils to help us connecting everything together.
Implementing the core logic of Holidays CLI
First, We need to implement a function that will display the result to the console in a human readable way. It’s better to implement this functionality in a separate function because we expect the output format to be changed often and in the future we might implement some other ways to show the results like for example, write them to a file or send emails to customers with the upcoming holidays.
For now, We will keep it very simple. Just a simple print to the console will be enough. The code should be something like this:
from typing import List

import click


def show_results(results: List[dict]) -> None:
    """
    Given a list of objects, it will print these data to the console in a human-readable way.
    """
    click.echo('result:')
    click.echo('----------------')
    for idx, item in enumerate(results):
        click.echo(f'{idx + 1}- {item}')
    click.echo('----------------')
Then, We will need to implement the caching logic. if there is no data available in the cache, we should call the HolidaysClient to fetch the data and save them to the cache. here is the code to do this:
from typing import List, Optional

import requests
from datetime import datetime

from cache import get_data_from_cache, save_data_to_cache
from client import NagerHolidaysClient


def get_next_occurring_holidays(data: List[dict], max_num: int = 5) -> List[dict]:
    """
    parse Holidays API response and get next n holidays
    :param data: Holidays API response
    :param max_num: number of holidays in the response
    :return: list of holidays
    """
    # get today's date
    today_date = datetime.now().date()

    # init the results
    result = []

    # for each holiday in the holiday api response
    for holiday in data:

        # break if we already reached the required number of holidays in the result
        if len(result) >= max_num:
            break

        # get the date of the current holiday
        holiday_date = datetime.strptime(holiday['date'], '%Y-%m-%d').date()

        # skip if the holiday date is in the past
        if today_date > holiday_date:
            continue

        # save the result
        result.append({
            'date': holiday['date'],
            'name': holiday['name'],
            'counties': holiday['counties'],
            'types': holiday['types'],
        })

    return result


def get_next_holidays_by_country_code(country_code, max_num=5, year=None) -> (Optional[str], Optional[List[dict]]):
    """
    given a country code and a year, it gets holidays from external API (or cache).
    :param country_code: 2 letters country code. case-insensitive
    :param max_num: number of holidays we want to get
    :param year: the year we want to get holidays for
    :return: error string if any error happens and list of results if there is no error
    """
    # caching key should be something like this `2022;DE`
    cache_key = f'{year};{country_code}'

    # check if the data is already cached
    data_from_cache = get_data_from_cache(cache_key)
    if data_from_cache:
        # if the data is in the cache then we don't need to call the external API
        print(f'Getting data from cache for country: {country_code} and year: {year}')
        result = get_next_occurring_holidays(data_from_cache, max_num)
        return None, result

    try:
        # getting the holidays from Nager Holidays API
        response_data = NagerHolidaysClient().get_holidays(country_code, year)
    except requests.exceptions.HTTPError:
        return 'HTTPError', None
    except requests.exceptions.JSONDecodeError:
        return 'JSONDecodeError', None

    print(f'saving data to cache for country: {country_code} and year: {year}')
    save_data_to_cache(cache_key, response_data)
    result = get_next_occurring_holidays(response_data, max_num)
    return None, result
Finally, We need to use this in the command main.py file so the final version of it should be like this
from datetime import datetime

import click

from usecases import get_next_holidays_by_country_code


__author__ = "Ramadan Khalifa"

from utils import show_results


@click.command()
@click.option(
    "--country-code",
    prompt="Country Code",
    help="Country code. complete list is here https://date.nager.at/Country."
)
@click.option(
    "--max-num",
    prompt="Max num of holidays returned",
    help="Max num of holidays returned.",
    default=5,
)
def main(country_code, max_num=5):
    """
    Simple CLI for getting the Public holidays of a country by country code.
    """
    # initialize the target year with the current year
    target_year = datetime.now().year
    results = []

    # loop until we reach our target number of holidays
    while len(results) < max_num:
        error, next_result = get_next_holidays_by_country_code(
            country_code, max_num=max_num - len(results), year=target_year
        )

        # show the error if there is any
        if error:
            click.echo(error)
            return

        # next
        results += next_result
        target_year += 1

    # print results to the user
    show_results(results)


if __name__ == "__main__":
    main()
This was a simple and straightforward project about holidays. We learned how to have independent modules for our project to help us extend our project in the future if needed. We also learned about docker, docker-compose and redis. We will dive deeper into those tools and will explore more in the upcoming tutorials. Please hit subscribe to get updates and new tutorials once they are available.